


Comparison of Different Models for Anomaly Recognition of Geochemical Data by Using Sample Ranking Method
-
摘要:
地球化学异常的有效识别是化探找矿成败的关键环节.利用样本排序方法对各种化探异常识别模型的处理效果和优劣性进行了比较.以云南个旧及其周边地区铜元素水系沉积物为例, 应用元素含量、异常衬度、局部奇异性分析三大类方法对数据进行了处理, 对化探异常指示变量的排序值进行了3个方面的对比: (1) 在高背景区和低背景区样品的排序特征; (2) 有矿出现位置处样品的样本排序特征; (3) 累积面积(等效于上侧样本排序值) 不同分组所圈定的异常范围和矿床(点) 之间的空间相关性.结果表明, 局部奇异性分析方法较按含量高低的全局性方法对弱缓异常识别更为有效, 也相对优于滑动衬值.按奇异性指数基于证据权法圈定的异常远景区更具预测意义, 显著优于用元素含量值所圈定的异常范围.局部奇异性方法原理清晰、方法简便、可操作性强, 在地球化学异常识别中可以用其替代滑动衬值方法.
Abstract:The geochemical anomaly recognition is the key to geochemical prospecting.Many new models are brought forward to identify and extract the geochemical weak anomalies from the complex background.How to compare the differences in aspect of the anomaly recognition effect of these different models? The authors advance the sample ranking method to discuss this problem.The gliding anomaly contrast and the local singularity analysis are applied to the Cu element data of the stream sediment samples from Gejiu area, Yunnan Province, China.The ranks for the raw data, contrast value and the local singularity exponents, denoted by RANK (Raw), RANK (CV) and RANK (Δα) respectively, are calculated by ordering the samples from the high anomaly to the low anomaly.Three ways are employed to compare the RANK (CV) and RANK (Δα) with the RANK (Raw) : (1) the characteristics of ranks for samples with the strong background and the weak background; (2) the characteristics of ranks for samples where the Cu deposits occur; and (3) the spatial correlation between the locations of Cu deposits and the cumulative area with the same thresholds of the upper rank values.The results demonstrate that the local singularity analysis is a useful model for the weak geochemical anomaly recognition, whose effect corresponds with the gliding anomaly contrast model or even better.The prospective areas delineated by means of weights of evidence method on the basis of local singularity exponents can provide new information and may be significant for the prediction of the undiscovered mineral deposits, which is significantly superior to the results on the basis of raw concentration data.The local singularity analysis has the advantage of the perspicuous principle, convenience and effective performance, and we can substitute it for the gliding contrast value method for the anomaly recognition of geochemical data.
-

图 1 云南个旧及其周边地区地质简图
Ⅰ.扬子克拉通; Ⅱ.华南褶皱系; Ⅲ.兰坪- 思茅褶皱系; ①红河断裂带; ②建水-弥勒- 师宗断裂带; ③哀牢山断裂带; ④小江断裂
Fig. 1. Simplified geological map of the study area in Gejiu and its surrounding areas, Yunnan Province, China
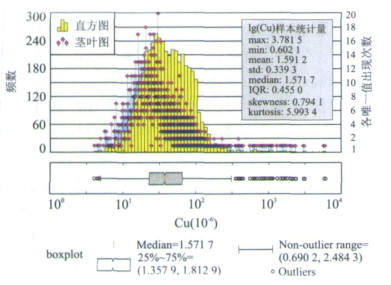
图 2 4524个Cu元素水系沉积物样品的统计分布特征
上方图形为直方图和茎叶图的叠合显示, 下方为箱线图, 直方图和箱线图取10为底的对数进行绘制.直方图统计的频数见上方图形左侧纵轴, 茎叶图按含量数据唯一值进行统计, 各唯一值重复出现次数见上方图形右侧纵轴
Fig. 2. Statistical distribution features of 4 524 Cu element data of the stream sediment samples
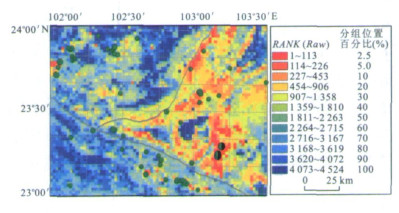
图 3 Cu元素含量RANK值色块图
图中圆形符号为铜矿产, 各单元色块代表面积4 km2
Fig. 3. Geochemical mapping for Cu concentrations
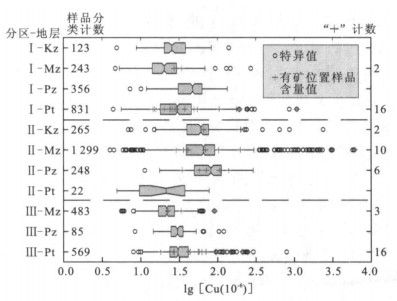
图 4 4 524个Cu样品按构造分区和地层分类统计的multi-boxplot图
Cu含量数据取常用对数进行统计, 在各个boxplot图形上叠加了“+”符号(红色), 表示有矿位置出样品Cu元素含量取值, 纵轴右侧表示了这些样品的个数
Fig. 4. Multi-boxplots of 4 524 Cu samples classified by the structural zones and strata
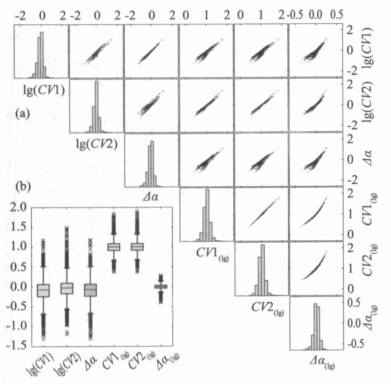
图 5 CV1、CV2、CV1(lg)、CV2(lg)、Δα和Δα(lg)的marix plot和multi-boxplot图
a.matrix plot图, 按对称性省略了左下角的X-Y plot图形, 对角线上为各个变量的统计直方图; b.multi-boxplot图, “x”符号表示特异值.以上变量均无量纲, CV1、CV2在图a、b中均先取常用对数再统计作图
Fig. 5. Matrix plot and multi-boxplot of the CV1, CV2, CV1(lg), CV2(lg), Δα, Δα(lg) mapping for the gliding contrast values and local singularity exponents of Cu element
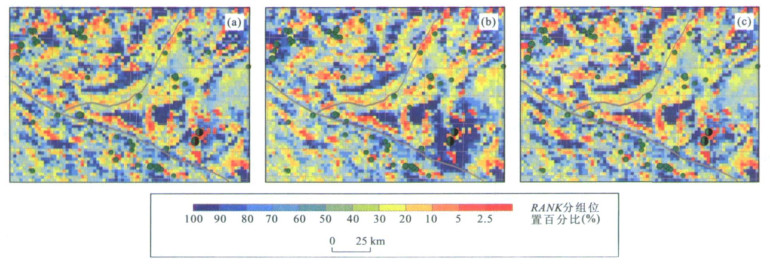
图 6 Cu元素滑动衬值和局部奇异性指数的RANK值色块图
a.RANK (CV2 (lg) ); b.RANK (Δα); c.RANK (Δα(lg) ).各色块图按相同的分类标准共分12类, 该分类标准与图 3相同
Fig. 6. Geochemical mapping for the gliding contrast values and local singularity exponents of Cu element

图 7 高背景区和低背景区不同异常指示变量的排序比较
a.各类方法对RANK (Raw) ≤56 (top 1.25%) 样品处理后排序值的变化; b.各类方法对3 498≤RANK (Raw) ≤3 553样品(自lg (Cu) 的第1四分位数1.357 9向低值区取56个) 处理后排序值的变化.a, b两图纵轴为分类轴, 标注格式为“Cu元素的rank值Cu元素含量值”, 自上而下按Cu元素的rank值升序排列; 左图横轴表示rank值, 右图横轴表示与rank值对应样品计算所得的Δα值和CV2 (lg) 值, 右图对分类轴各样品的属性作辅助说明
Fig. 7. Comparison of sample ranking of the different geochemical anomalies in the areas with the high and low backgrounds respectively

图 8 不同异常指示变量在55个铜矿位置处化探样品的排序比较
a.按RANK (Raw) 升序排列比较.纵轴为分类轴, 标注格式为“Cu元素的rank值Cu元素含量值”, 自上而下按Cu元素的rank值降序排列; 左图横轴表示rank值, 右图横轴表示与rank值对应样品计算所得的Δα值和CV2 (lg) 值, 右图对分类轴各样品的属性作辅助说明.b.按RANK (Δα) 升序排列比较.纵轴为分类轴, 标注格式为“Δα的rank值Δα值CV2 (lg) 值Cu元素含量值”, 自上而下按Δα的rank值升序排列; 横轴表示rank值
Fig. 8. Comparison of the sample ranking of the different geochemical anomaly indexes at the sites of 55 Cu deposits occurring
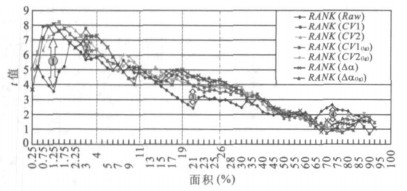
图 9 不同模型异常指示变量应用证据权法的化探异常累积面积-t统计量图
箭头及其数字1, 2, 3, 4标明了RANK(Raw) 的t曲线与其他t曲线具有明显差异的位置
Fig. 9. Student's t statistics calculated by weights of evidence method for measuring spatial correlation between locations of 55 Cu deposits and the areas with geochemical anomaly indexes employing different models for anomaly recognition
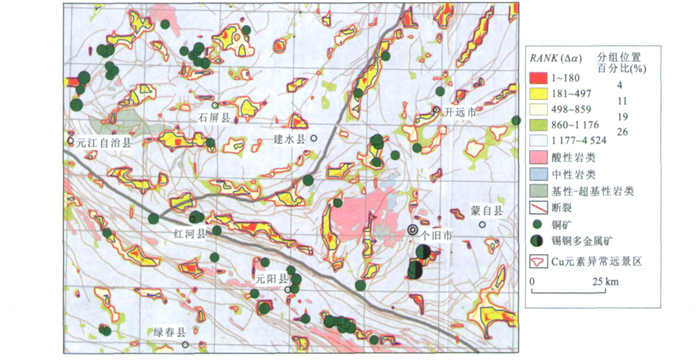
图 10 用RANK (Δα) 圈定Cu元素化探异常远景区
Fig. 10. Prospective areas of Cu element delineated by RANK (Δα)
表 1 不同异常指示变量在原始排序后45个有矿位置处化探样品的排序升降情况
Table 1. Rank changes of different anomaly indexes at the sites of 45 Cu deposits occuring with low RANK (Raw) values

-
Agterberg, F. P., 1989. Computer programs for mineral exploration. Science, 245: 76-81. doi: 10.1126/science.245.4913.76 Agterberg, F. P., Bonham-Carter, G. F., Cheng, Q. M., 1993. Weights of evidence modeling and weighted logis-tic regression for mineral potential mapping. In: Davis, J. C., Herzfeld, U. C., eds., Computers in geology. Oxford University Press, New York, 13-32. Bao, Z. Y., Li, F. L., Jia, X. Q., 1999. Methodology of temporal-spatial structure of geochemical fields. Earth Science—Journal of China University of Geosciences, 24 (3): 282-286 (in Chinese with English abstract). Bonham-Carter, G. F., 1994. Geographic information systemfor geosciences: Modelling with GIS. Pergamon Press, Oxford, 398. Chen, Z. J., 2007. Multifractal theory based local singularity analysis method and its application in spatial information extraction for mineral exploration (Dissertation). China University of Geosciences, Wuhan (in Chinesewith English abstract). Chen, Z. J., Cheng, Q. M., Chen, J. G., et al., 2007. A noveliterative approach for mapping local singularities from geochemical data. Nonlin. Processes Geophys. , 14: 317-324. doi: 10.5194/npg-14-317-2007 Cheng, Q. M., 1999a. Spatial and scaling modeling for geochemical anomaly separation. Journal of Geochemical Exploration, 65: 175-194. doi: 10.1016/S0375-6742(99)00028-X Cheng, Q. M., 1999b. Multifractality and spatial statistics. Computers & Geosciences, 25 (9): 949-961. Cheng, Q. M., 2006a. GIS-based fractal/multifractal anomaly analysis for modeling and prediction of mineralization and mineral deposits. In: Harris, J. R., ed., GIS applica-tionin the earth sciences—GAC special paper. Geolog-ical Association of Canada Special Book, 285-296. Cheng, Q. M., 2006b. Mapping singularities with stream sediment geochemical data for prediction of undiscovered mineral deposits in Gejiu, Yunnan Province, China. OreGeology Reviews, 32: 314-324. Cheng, Q. M., 2008. Singularity of mineralization and multi-fractal distribution of mineral deposits. Bulletin of Mineralogy, Petrology and Geochemistry, 27 (3): 299-305 (in Chinese with English abstract). Cheng, Q. M., Agterberg, F. P., 2008. Singularity analysis of ore-mineral and toxic trace elements in stream sediments. Computers & Geosciences, DOI: 10.1016/j.cageo.2008.02.034. Cheng, Q. M., Agterberg, F. P., Ballantyne, S. B., 1994. The separation of geochemical anomalies from background by fractal methods. Journal of Geochemical Exploration, 51 (2): 109-130. doi: 10.1016/0375-6742(94)90013-2 Cheng, Q. M., Agterberg, F. P., Bonham-Carter, G. F., 1996. Spatial analysis method for geochemical anomaly separation. Journal of Geochemical Exploration, 56 (3): 183-195. doi: 10.1016/S0375-6742(96)00035-0 Cheng, Q. M., Xu, Y., Grunsky, E., 2000. Integrated spatial and spectrum method for geochemical anomaly separation. Natural Resources Research, 9 (1): 43-51. doi: 10.1023/A:1010109829861 Grunsky, E. C., 2007. The interpretation of regional geo-chemical survey data. In: Gubins, A. G., ed., Proceed-ings of Exploration2007: Fifth Decennial International Conference on Mineral Exploration, 139-182. Han, D. Y., Gong, Q. J., Xiang, Y. C., 2004. Some new fractal methods for regional geochemical survey data processing. Geological Bulletion of China, 23 (7): 714-719 (in Chinese with English abstract). Li, C. J., Ma, T. H., Shi, J. F., 2003. Application of a fractal method relating concentrations and distances for separa-tion of geochemical anomalies from background. Journal of Geochemical Exploration, 77: 167-175. doi: 10.1016/S0375-6742(02)00276-5 Martinez, W. L., Martinez, A. R., 2005. Exploratory data analysis with MATLAB. Chapman & Hall/CRC, New York, 405. Reimann, C., Filzmoser, P., Garrett, R. G., 2005. Background and threshold: Critical comparison of methods of determination. Science of the Total Environment, 346: 1-16. doi: 10.1016/j.scitotenv.2004.11.023 Shi, C. Y., Zhang, J. H., Huang, X. M., 1999. Subregion median contrast filtering method and recognition of weak anomalies. Geophysical & Geochemical Exploration, 23 (4): 250-257 (in Chinese with English abstract). Tukey, J. W., 1997. Exploratory data analysis. Addison-Wesley, Reading. Wang, B. L., Lü, S. K., Hu, J. G., 2004. Atentative description of the Chuan-Dian-Qian rhombic massif. Yunnan Geology, 23 (2): 140-153 (in Chinese). Xiong, G. C., Xie, D. S., Zhang, W. B., et al., 1997. The rapid exploration method and technique systems for metallic minerals in Xinjiang Province. Geological Publishing House, Beijing (in Chinese). Zhuang, Y., Q., Wang, R. Z., Yang, S. P., et al., 1996. Geology of Gejiu tin-copper polymetallic deposit. China Seismic Publishing House, Beijing (in Chinese). 鲍征宇, 李方林, 贾先巧, 1999. 地球化学场时-空结构分析的方法体系. 地球科学——中国地质大学学报, 24 (3): 282-286. https://www.cnki.com.cn/Article/CJFDTOTAL-DQKX903.014.htm 陈志军, 2007. 多重分形局部奇异性分析方法及其在矿产资源信息提取中的应用(博士学位论文). 武汉: 中国地质大学. 成秋明, 2008. 成矿过程奇异性与矿床多重分形分布. 矿物岩石地球化学通报, 27 (3): 299-305. https://www.cnki.com.cn/Article/CJFDTOTAL-KYDH200803014.htm 韩东昱, 龚庆杰, 向运川, 2004. 区域化探数据处理的几种分形方法. 地质通报, 23 (7): 714-719. doi: 10.3969/j.issn.1671-2552.2004.07.014 史长义, 张金华, 黄笑梅, 1999. 子区中位数衬值滤波法及弱小异常识别. 物探与化探, 23 (4): 250-257. doi: 10.3969/j.issn.1000-8918.1999.04.002 王宝碌, 吕世琨, 胡居贵, 2004. 试论川滇黔菱形地块. 云南地质, 23 (2): 140-153. https://www.cnki.com.cn/Article/CJFDTOTAL-YNZD200402002.htm 熊光楚, 谢德顺, 张文斌, 等, 1997. 新疆金属矿产快速勘查方法技术系统. 北京: 地质出版社. 庄永秋, 王任重, 杨树培, 等, 1996. 云南个旧锡铜多金属矿床. 北京: 地震出版社. -

 下载:
下载:
 点击查看大图
计量
- 文章访问数: 3848
- HTML全文浏览量: 602
- PDF下载量: 71
- 被引次数: 0
