


MULTIFRACTAL SIMULATION OF GEOCHEMICAL MAP PATTERNS
-
摘要: 利用一个简单的基于De Wijs模型的多重分形模型, 可以模拟元素富集值的各种地球化学纹理.每种纹理在平均值上是自相似的, 因为将乘积阶次模型(multiplicative cascade model) 应用到任何子区均能得出类似的纹理样式.在其他的试验中, 通过叠加一个二维趋势纹理(2-dimensional trend pattern) 以及把它与一个常值富集模型混合, 原始的自相似纹理就产生畸变.本文将要研究这些畸变是如何改变用三步矩(3-step method of moments) 所估测的多重分形谱(multifractal spectrum).推导出了满足De Wijs模型纹理的离散和连续频率分布模型.这些模拟纹理满足离散频率分布模型, 当乘积阶次模型(multipicative cascade model) 无限细分时, 假设离散频率分布模型的上界是一连续频率分布, 这个离散分布就在形式上逼近该连续频率分布的上边界.这一极限分布在中心是对数正态的, 但有两个巴利多(Pareto) 分布的尾.这种方法在矿产和油气评价中有重要的潜在意义.Abstract: Using a simple multifractal model based on the model De Wijs, various geochemical map patterns for element concentration values are being simulated. Each pattern is self-similar on the average in that a similar pattern can be derived by application of the multiplicative cascade model used to any small subarea on the pattern. In other experiments, the original, self-similar pattern is distorted by superimposing a 2-dimensional trend pattern and by mixing it with a constant concentration value model. It is investigated how such distortions change the multifractal spectrum estimated by means of the 3-step method of moments. Discrete and continuous frequency distribution models are derived for patterns that satisfy the model of De Wijs. These simulated patterns satisfy a discrete frequency distribution model that as upper bound has a continuous frequency distribution to which it approaches in form when the subdivisions of the multiplicative cascade model are repeated indefinitely. This limiting distribution is lognormal in the center and has Pareto tails. Potentially, this approach has important implications in mineral and oil resource evaluation.
-
Key words:
- Fractal /
- multifractal /
- model of De Wijs /
- geochemistry /
- map pattern /
- computer simulation.
-
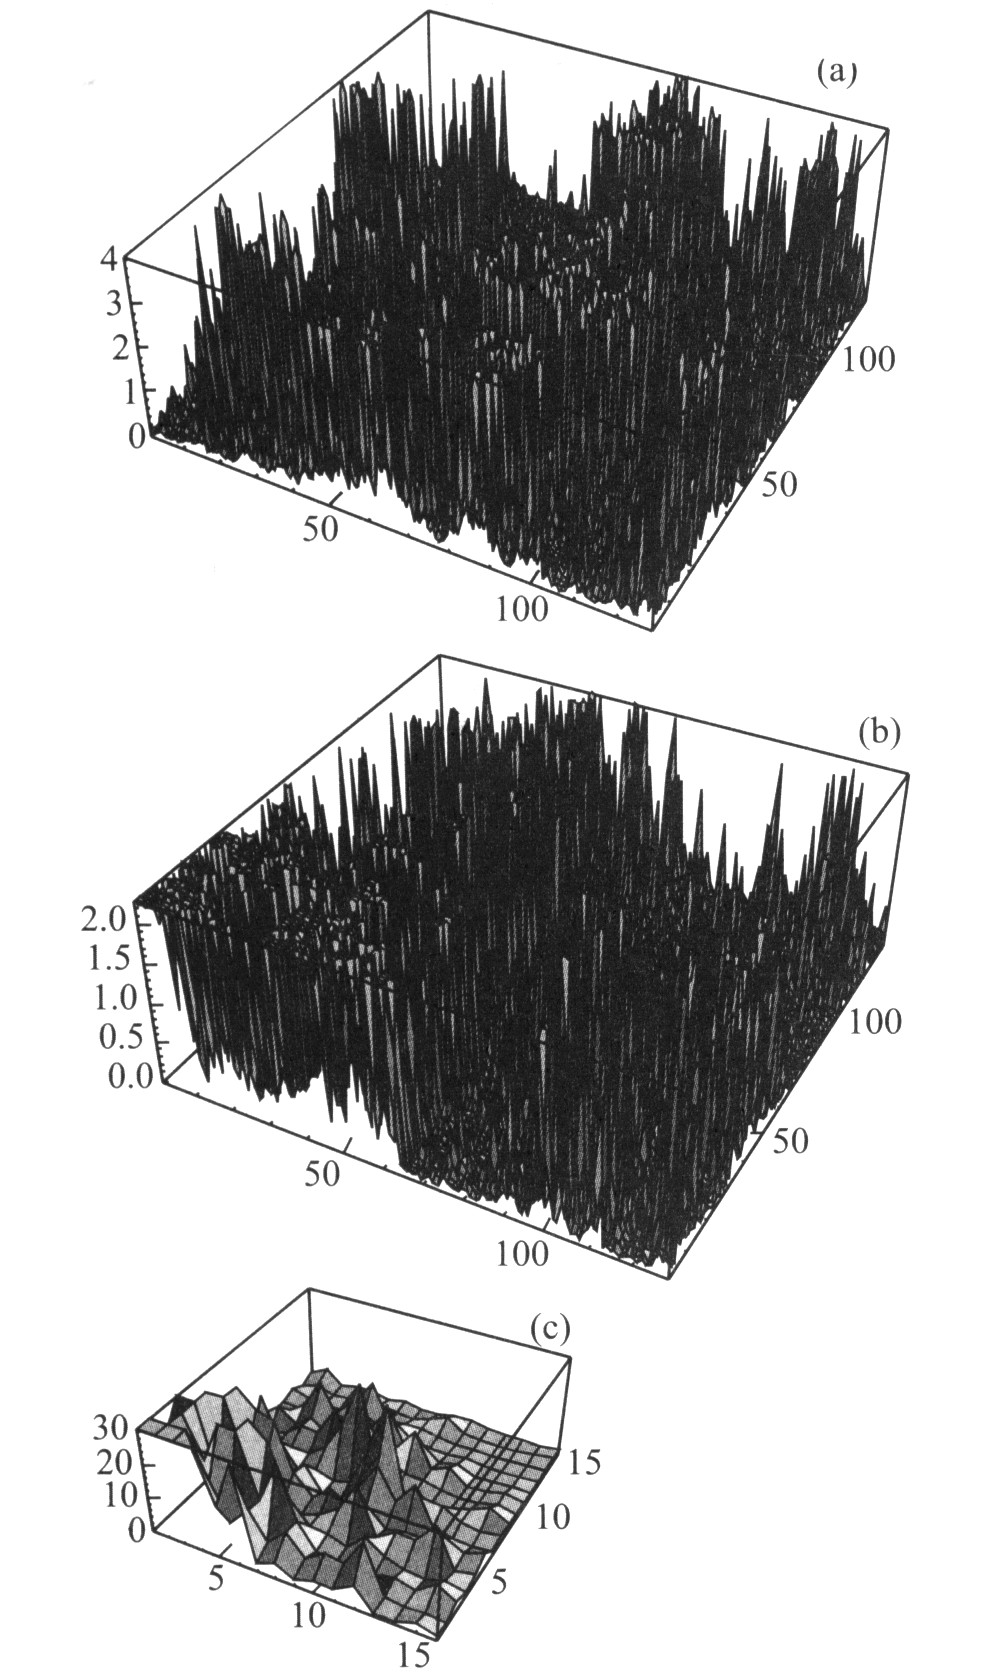
图 1 元素富集品位(整体平均值等于1) 两种模拟图纹的三维图
a.原始模型的128×128个数据矩阵; b.根据幂次律函数向原始模型数据矩阵叠加了趋势的矩阵, 幂次律函数是通过一因子10使得矩阵最大值出现在原始数据最小值的相反方向处; c.b中矩阵的一部分. (这些是用Mathematica 4软件获得的彩色图的黑白版本)
Fig. 1. Three-dimensional plots of two simulated map patterns for element concentration values (overall mean value is equal to 1) obtained by means of a stochastic version of the model of De Wijs; largest values truncated at upper end
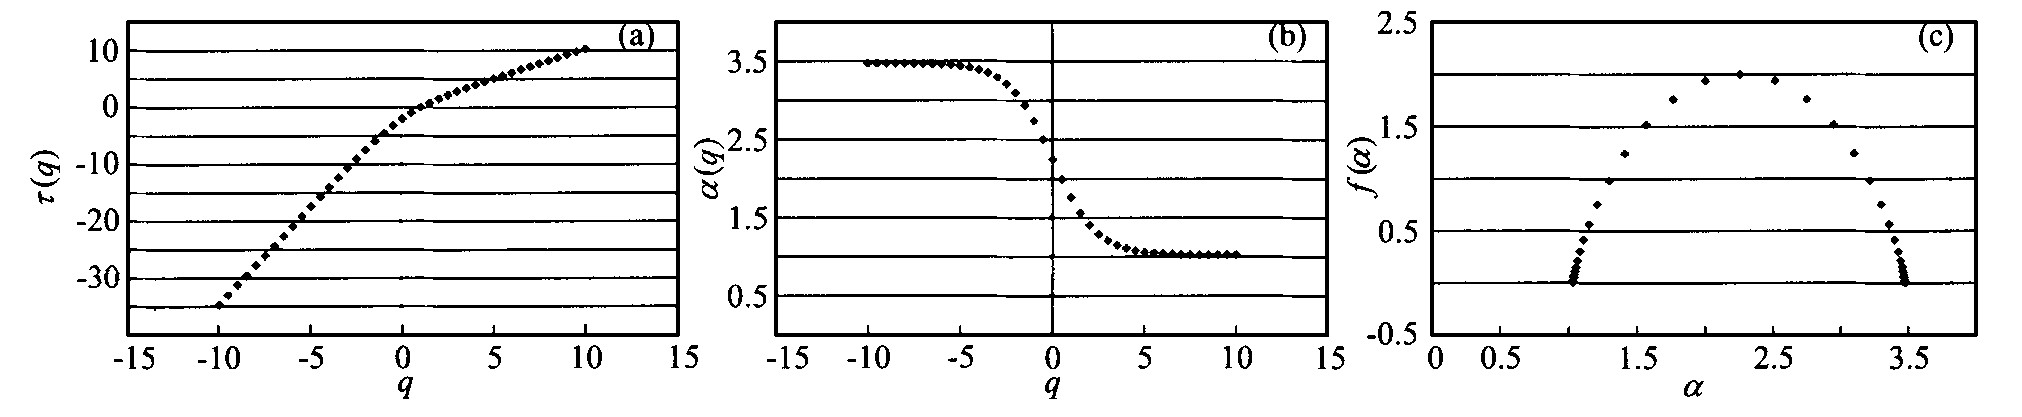
图 3 对图 2继续运用计算矩的方法
a.主体指数τ (q) 和q之间的关系; b.奇异指数α (q) 和q之间的关系; c.多重分形谱值f (α) 与奇异指数α之间的关系
Fig. 3. Method of moments continued from
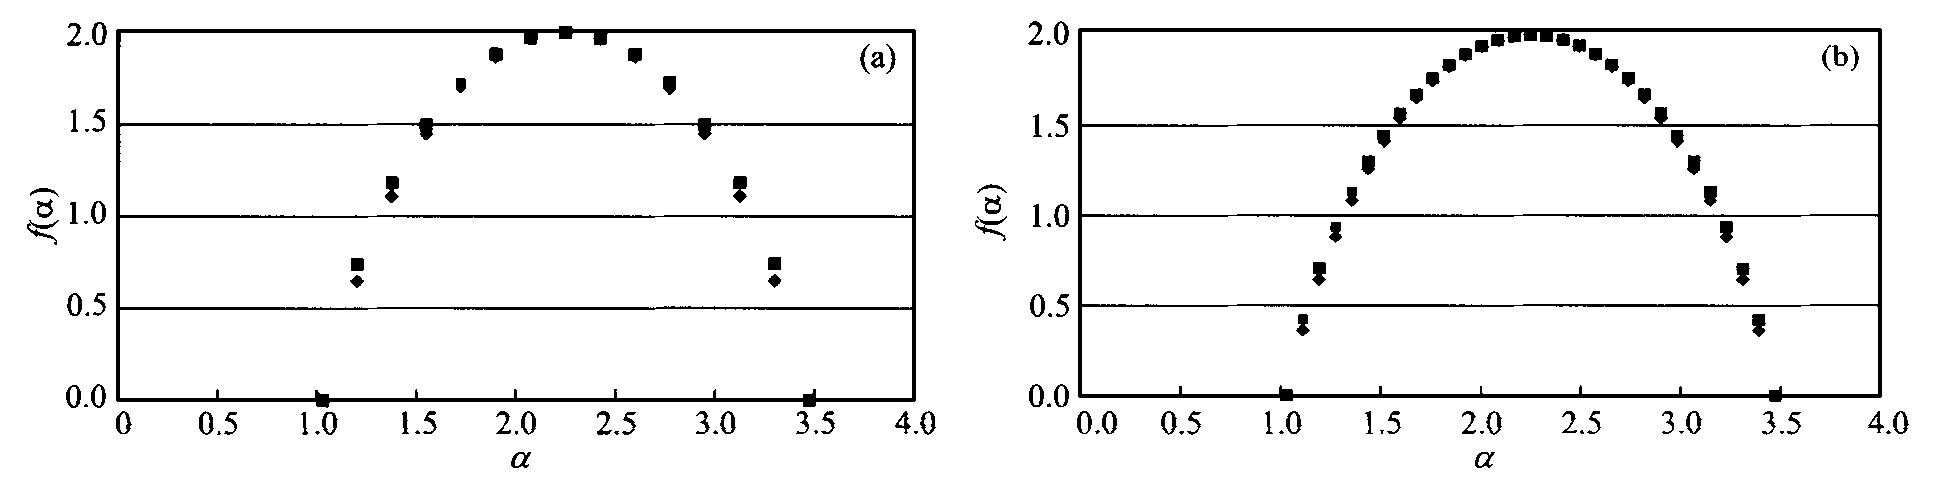
图 4 d取不同值时直方图法在图 1a纹理中的应用
a.d=0.4, n=14;b.d=0.4, n=30
Fig. 4. Fig.4 Histogram method applied to pattern of Fig.1a with different values d, n
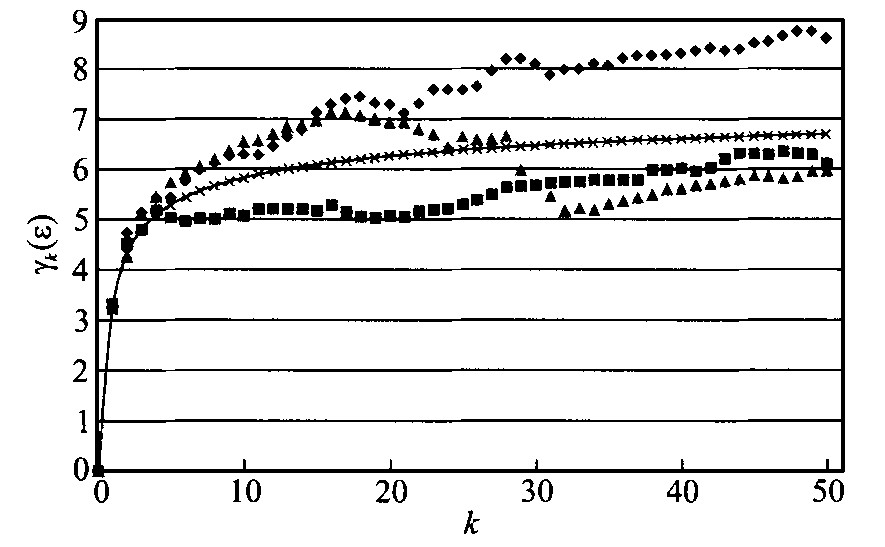
图 5 与3个实验半方差图相对比的理论多重分形半方差图
它来自纹理的128行数据, 这些纹理与图 1a相似.实验半方差图与连续曲线之间的偏差相对较大, 但可能没有很大的差别
Fig. 5. Theoretical form of multifractal semivariogram in comparison with three experimental semivariograms

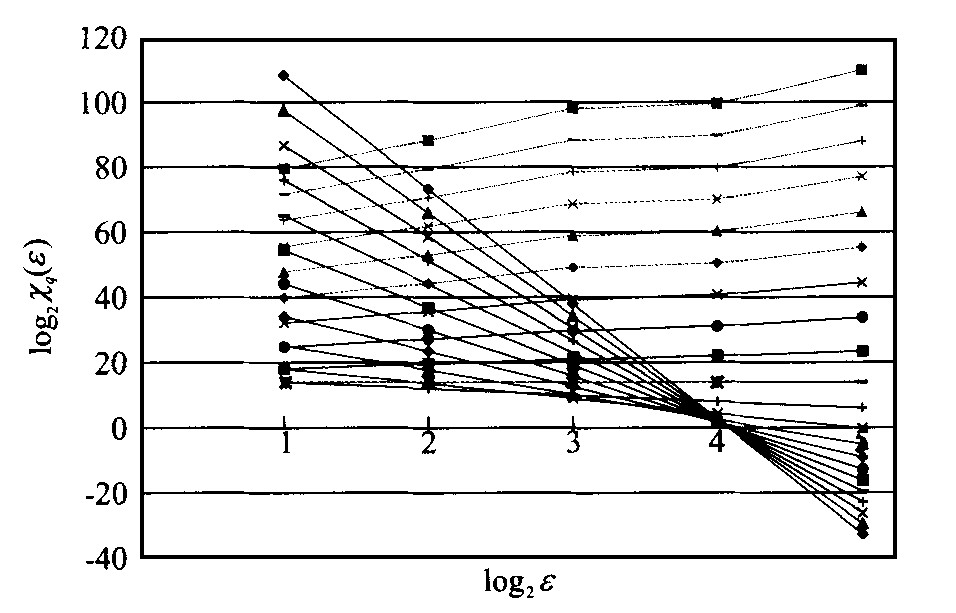
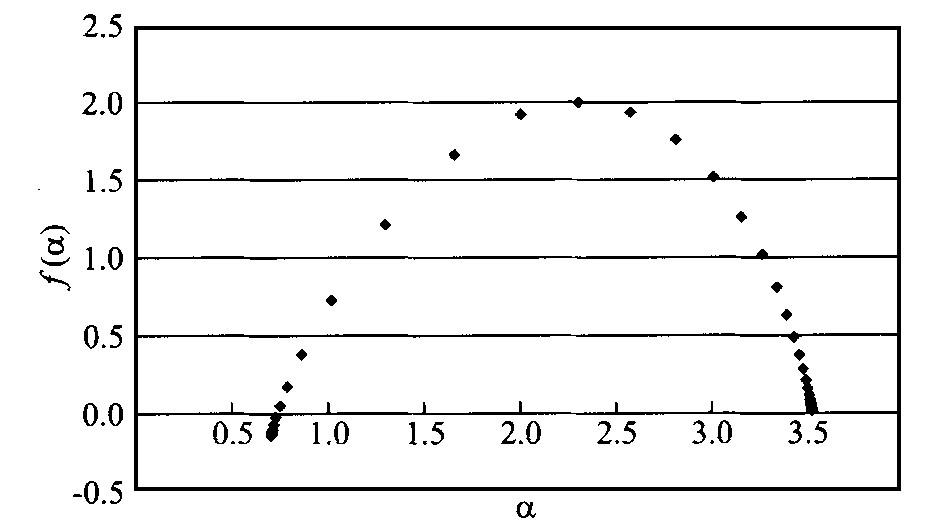

图 9 a.直方图法在d取0.6、n取20时在品位数据中的应用; b.与a中两个多元谱相关的频率分布曲线; 极限形式的频率差不多接近对数二项频率, 但不同的是0在中心和端点处; c.在Q-Q坐标图上, 上界频率分布的对数正态分布
Fig. 9. a: Histogram method illustrated in Fig.4 applied to concentration values with d=0.6 and n=20; b: Frequency distribution curves corresponding to the two multivariate spectra shown in Fig.9a; frequences of limiting form slightly exceed logbinomial frequencies but difference is zero in the center and at the endpoints; c: Lognormal Q-Q plot of upper bound frequency distribution shown in Fig.9b
-
[1] Feder J. Fractals [M ]. NewYork: Plenum, 1988.283. [2] Lovejoy S, Schertzer D. Multifractals, universality classes, and satellite and radar measurements of cloud and rain fields[J]. Jour Geophys Res, 1990, 95 (D3): 2021~2034. doi: 10.1029/JD095iD03p02021 [3] Stanley H E, Meakin P. Multifractal phenomena in physics and chemistry[J]. Nature, 1998, 335 (6189): 405 ~409. [4] Herzfeld U C. Fractals in geosciences-challenges and concerns [A]. In: Davis J C, Herzfeld U C, eds. International Assoc Math Geol Studies in Mathematical Geology[C]. New York: Oxford Univ Press, 1993.176~230. [5] Herzfeld U C, Kim I I, Orcutt J A. Is the ocean floor a fractal?[J]. Mathematical Geology, 1995, 27 (3): 421~442. doi: 10.1007/BF02084611 [6] Herzfeld U C, Overbeck C. Analysis and simulation of scale-dependent fractal surfaces with application to seafloor morphology[J]. Computers & Geosciences, 1999, 25 (9): 979~1007. [7] Evertsz C J G, Mandelbrot B B. Multifractal measures (Appendix B) [A]. In: Peitgen H -O, Jurgens H, Saupe D, eds. Chaos and fractals[C]. New York: Springer Verlag, 1992.922~953. [8] Agterberg F P. Fractals, multifractals, and change of support [A]. In: Dimitrakopoulos R, ed. Geostatistics for the next century[C]. Dordrecht: Kluwer, 1994.223~234. [9] De Wijs H J. Statistics of ore distribution[J]. Geologie en Mijnbouw, 1951, 13: 365~375. [10] Matheron G. Traité de Géostatistique Appliquée. Mémoires Bur Rech[J]. GéolMinières, 196 2, 14: 33. [11] Cheng Q, Agterberg F P. Multifractal modeling and spatial statistics[J]. Mathematical Geol, 1996, 28 (1): 1~16. doi: 10.1007/BF02273520 [12] Krige D G. Lognormal-De wijsian geostatistics for ore evaluation [M ]. Johannesburg: South African Inst Mining Metall, 1978.50. [13] Cheng Q, Agterberg F P, Balantyne S B. The separation of geochemical anomalies from background by fractal methods[J]. Jour Geochem Exploration, 1994, 51: 109~130. doi: 10.1016/0375-6742(94)90013-2 [14] Agterberg F P. Multifractal modeling of the sizes and grades of giant and supergiant deposits[J]. International Geology Review, 1995, 37 (1): 1~8. doi: 10.1080/00206819509465388 [15] Harris D P. Mineral resources appraisal [M ]. Oxford: Clarendon Press, 1984.445. [16] Cargill S M, Root D H, Bailey E H. Estimating usable resources from historical industry data[J]. Economic Geol, 1981, 84: 10811095. [17] Lee P J. Statistical methods for estimating petroleum resources [M ]. Taiwan: Department of Earth Sciences, National Cheng Kung University, 1999.270. [18] Drew L J, Schuenemeyer J H, Bawiec W J. Estimation of the future rates of oil and gas discoveries in the western gulf of Mexico[J]. US Geol Survey Profess Paper, 1982, 1252: 26. [19] Meneveau C, Sreenivasan K R. Simple multifractal cascade model for fully developed turbulence[J]. Phys Review Letters, 1987, 59: 424~1427. [20] Schertzer D, Lovejoy S, Schmitt F, et al. Multifractal cascade dynamics and turbulent intermittency[J]. Fractals, 1997, 5 (3): 427~471. doi: 10.1142/S0218348X97000371 [21] Cheng Q. Multifractal modelling and spatial analysis with GIS: gold potential estimation in the Mitchell-Sulphurets area, nort western British Columbia[D]. Canada: University of Ottawa, 1994.268. [22] Sim B B L, Agterberg F P, Beaudry Ch. Determining the cutoff between background and relative base metal smelter contamination levels using multifractals methods[J]. Computers & Geosciences, 1999, 25 (7): 1023~1041. [23] Switzer P, McBride S. Modeling indoor air pollution using superposition[J]. Bulletin International Statistical Institute, Tome LVIII, 1999, Book2: 501~504. [24] Agterberg F P. Discussion of "Statistical aspects of physical and environmental science"[J]. Bulletin International Statistical Institute, Tome 58, 1999, Book3: 213~214. [25] Agterberg F P, Cheng Q, Wright D F. Fractal modeling of mineral deposits [A]. In: Elbrond J, Tang X, eds. Proceedings, APCOM XXIV, international symposium on the application of computers and operations research in the mineral industries[C]. Montréal, Canada: Canad Inst Mining Metall, 1993.43~53. -

 下载:
下载:
 点击查看大图
计量
- 文章访问数: 4026
- HTML全文浏览量: 733
- PDF下载量: 18
- 被引次数: 0
