


-
-
关键词:
Abstract: For national or global resource estimation of frequencies of metals, a lognormal distribution has commonly been recommended but not adequately tested. Tests of frequencies of Cu, Zn, Pb, Ag, and Au contents of 1 984 well-explored mineral deposits display a poor fit to the lognormal distribution. When the same metals plus Mo, Co, Nb2O3, and REE2O3 are grouped into 19 geologically defined deposit types, only eight of the 73 tests fail to be fit by lognormal distribution, and most of those failures are in two deposit types suggesting a problem with those types. Estimates of the mean and standard deviation of each of the metals in each of the deposit types are provided for modeling.-
Key words:
- mineral deposit model /
- spatial rule /
- grade and tonnage model
-
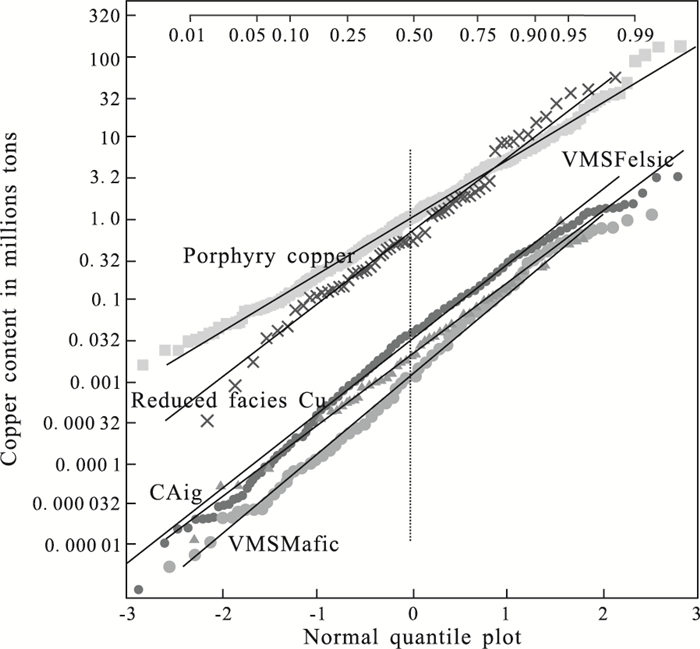
Fig. 1. The copper content of porphyry Cu, reduced facies Cu, carbonate-hosted igneous related, volcanic-hosted massive sulfide felsic-related, and volcanic-hosted massive sulfide mafic-related deposits plotted against each type's straight line representing its standard normal distribution
Table 1. Copper content distributions by deposit type and tests of lognormality. Mean metric tons of contained copper (log10 data), standard deviation (log10 data), median observed copper content of all deposits, Shapiro-Wilk goodness-of-fit probability of lognormal distribution, number of deposits with reported grade, and total number of deposits with reported tonnage (in thousands t)
Deposit type Mean St. dev. Median Cu (kt) Prob. Number deposits Total number deposits CAam 4.355 1 0.941 2 0 0.797 9 132 CAig 4.315 4 0.876 4 0 0.892 86 187 FeOxideCuAu 5.644 4 0.779 4 376 0.819 32 36 Kipushi 5.438 5 0.894 1 480 0.668 8 8 MLig 4.854 3 0.735 3 0 0.587 12 38 MLme 4.207 3 0.761 1 0 0.296 5 12 PorCu 6.008 6 0.703 1 1 030 0.391 422 422 RedbedCu 4.494 0 0.804 0 21 0.030 33 33 Reduced Cu 5.819 9 0.898 3 500 0.647 62 62 Revett Cu 5.224 0 0.931 5 125 0.934 14 14 SedHstCu 5.076 4 0.920 1 120 0.952 31 31 SHam 5.107 2 1.133 5 0 0.983 7 25 SHig 4.503 4 0.822 4 0 0.487 13 32 SSPb 3.830 8 1.625 7 0 0.042 5 22 VMSBimodal 4.376 7 0.929 2 26 0.666 267 272 VMSFelsic 4.480 2 0.920 0 36 0.001 411 421 VMSMafic 4.061 3 0.983 6 11 0.066 174 175  下载: 导出CSV
Table 2. Zinc content distributions by deposit type and tests of lognormality. Mean metric tons of contained zinc (log10 data), standard deviation (log10 data), median observed zinc content of all deposits, Shapiro-Wilk goodness-of-fit probability of lognormal distribution, number of deposits with reported grade, and total number of deposits with reported tonnage (in thousands t)
Deposit type Mean St. dev. Median Zn (kt) Prob. Number deposits Total number deposits CAam 5.648 1 0.756 7 498 0.338 128 132 CAig 5.359 4 0.917 6 308 0.002 185 187 CAme 5.372 5 0.744 5 128 0.378 7 7 Kipushi 5.765 9 1.226 1 5 0.335 4 8 MLig 5.609 9 0.876 0 354 0.926 38 38 MLme 5.169 1 1.025 0 96 0.888 12 12 SHam 6.334 1 0.674 9 1 600 0.924 25 25 SHig 5.757 5 0.994 9 644 0.511 30 32 SSPb 4.628 2 1.543 8 8 0.264 16 22 VMSBimodal 4.716 6 0.923 1 30.5 0.407 217 272 VMSFelsic 5.043 7 0.892 7 75 0.000 349 421 VMSMafic 4.325 7 0.733 8 0 0.383 58 175
下载: 导出CSV
Table 3. Lead content distributions by deposit type and tests of lognormality. Mean metric tons of contained lead (log10 data), standard deviation (log10 data), median observed lead content of all deposits, Shapiro-Wilk goodness-of-fit probability of lognormal distribution, number of deposits with reported grade, and total number of deposits with reported tonnage (in thousands t)
Deposit type Mean St. dev. Median Pb (kt) Prob. Number deposits Total number deposits CAam 5.176 4 0.822 2 146 0.647 121 132 CAig 5.181 3 0.857 3 130 0.230 166 187 CAme 5.044 8 0.801 0 30 0.243 6 7 Kipushi 5.291 9 1.161 9 275 0.123 6 8 MLig 5.372 9 0.885 2 169 0.838 34 38 MLme 4.852 3 0.830 0 45 0.420 11 12 SHam 5.823 6 0.718 4 592 0.482 25 25 SHig 5.428 0 1.041 9 721 0.066 32 32 SSPb 5.167 4 0.852 6 204 0.691 22 22 VMSBimodal 4.058 6 0.844 2 0 0.006 77 272 VMSFelsic 4.497 6 0.982 0 7 0.005 273 421 VMSMafic 3.564 9 1.018 0 0 0.636 6 13 175
下载: 导出CSV
Table 4. Silver content distributions by deposit type and tests of lognormality. Mean metric tons of contained silver (log10 data), standard deviation (log10 data), median observed silver content of all deposits, Shapiro-Wilk goodness-of-fit probability of lognormal distribution, number of deposits with reported grade, and total number of deposits with reported tonnage (in t)
Deposit type Mean St. dev. Median Ag (t) Prob. Number deposits Total number deposits CAam 2.275 0 0.759 8 0 0.875 58 132 CAig 2.651 2 0.939 1 144 0.147 138 187 CAme 2.045 0 0.927 6 26 0.210 5 7 FeOxideCuAu 1.918 2 1.155 2 0 0.621 10 36 Kipushi 2.692 5 0.968 3 193 0.970 6 8 MLig 2.688 5 0.951 3 106 0.928 26 38 MLme 2.588 2 0.702 0 32 0.565 6 12 PorCu 2.897 5 0.692 6 0 0.584 172 422 RedbedCu 1.544 1 1.142 0 0 0.698 10 33 Reduced Cu 2.678 0 1.053 5 0 0.274 16 62 Revett Cu 2.807 3 0.756 3 140 0.097 8 14 SedHstCu 1.797 9 0.988 4 0 0.153 7 31 SHam 3.067 3 0.783 8 277 0.540 18 25 SHig 2.760 3 0.999 9 786 0.056 28 32 SSPb 2.041 5 0.904 8 2 0.344 11 22 VMSBimodal 1.754 9 0.936 8 10 0.816 172 272 VMSFelsic 2.051 3 0.958 1 32 0.003 300 421 VMSMafic 1.442 0 1.058 8 0 0.399 70 175
下载: 导出CSV
Table 5. Gold content distributions by deposit type and tests of lognormality. Mean metric tons of contained gold (log10 data), standard deviation (log10 data), median observed gold content of all deposits, Shapiro-Wilk goodness-of-fit probability of lognormal distribution, number of deposits with reported grade, and total number of deposits with reported tonnage (in t)
Deposit type Mean St. dev. Median Au (t) Prob. Number deposits Total number deposits CAam 0.985 7 0.402 7 0 0.424 3 132 CAig 0.676 6 1.026 3 0 0.002 70 187 FeOxideCuAu 1.313 5 0.797 8 12 0.563 27 36 MLig 0.408 9 0.766 9 0 0.039 7 38 PorCu 1.678 6 0.712 5 12 0.631 256 422 SHam 0.755 8 0.444 6 0 0.695 4 25 SHig 0.662 0 1.190 3 0 0.135 14 32 VMSBimodal 0.309 1 0.956 7 0 0.093 158 272 VMSFelsic 0.430 6 0.980 7 1 0.000 279 421 VMSMafic 0.058 6 1.042 8 0 0.121 72 175
下载: 导出CSV
Table 6. Molybdenum, cobalt, Nb2O5, and REE2O3 content distributions by deposit type and tests of lognormality. Mean metric tons of contained molybdenum (median observed Mo content in all deposits), cobalt (median observed cobalt content in all deposits), Nb2O5, and REE2O3 (log10 data), standard deviation (log10 data), Shapiro-Wilk goodness-of-fit probability of lognormal distribution, number of deposits with reported grade, and total number of deposits with reported tonnage (in thousands t)
Deposit type Mean Mo
(median Mo (kt))Mean Co
(median Co (kt))Mean Nb2O3
(median Nb2O3 (kt))Mean REE2O3
(median REE2O3 (kt))St. dev. Prob. Number deposits Total number deposits PorCu 4.618
(28)0.765 4 0.592 228 422 Reduced Cu 5.088 1
(0)0.800 4 0.633 15 62 Carbonatite 5.325 8
(0)1.102 5 0.737 39 55 Carbonatite 5.558 9
(68)1.079 3 0.925 35 55
下载: 导出CSV
-
Ahrens, L.H., 1954. The log-normal distribution of the elements (a fundamental law of geochemistry and its subsidiary). Geochimica et Cosmochimica Acta, 5: 49-73. doi: 10.1016/0016-7037(54)90040-X Aitchison, J., Brown, J.A.C., 1963. The lognormal distribution. Cambridge University Press, London, 177. Allais, M., 1957. Method of appraising economic prospects of mining exploration over large territories—Algerian Sahara case study. Management Science, 3(4): 285-347. doi: 10.1287/mnsc.3.4.285 Berger, V.I., Singer, D.A., Orris, G.J., 2009. Carbonatites of the world, explored deposits of Nb and REE: database and grade and tonnage models. U.S. Geological Survey Open-File Report 2009-1139, 17 and database. http://pubs.usgs.gov/of/2009/1139/. Cox, D.P., Lindsey, D.A., Singer, D.A., et al., 2003. Sediment-hosted copper deposits of the world—deposit models and database. Revised 2007. U.S. Geological Survey Open-File Report 2003-107, v. 1.3. http://pubs.usgs.gov/of/2003/of03-107/. Cox, D.P., Singer, D.A., 2007. Descriptive and grade-tonnage models and database for iron oxide Cu-Au deposits. U.S. Geological Survey Open-File Report 2007-1155. http://pubs.usgs.gov/of/2007/1155/. Griffiths, J.C., Singer, D.A., 1973. Size, shape, and arrangement of some uranium ore bodies. 11th International Symposium on Computer Applications in the Mineral Industry, B82-B110. Matheron, G., 1959. Remarques sur la loi de Lasky. Chronique des Mines d'Outre-Mer et de la Recherche Miniere, 27e annee, (282): 463-465. Mosier, D.L., Berger, V.I., Singer, D.A., 2009. Volcanogenic massive sulfide deposits of the world—database and grade and tonnage models. U.S. Geological Survey Open-File Report 2009-1034. http://pubs.usgs.gov/of/2009/1034/. Rasumovsky, N.K., 1940. Distribution of metal values in ore deposits. Acad. Sci. Comptes Rendus (Doklady) U.R.S.S., 28: 814-816. http://www.researchgate.net/publication/312448454_Distribution_of_metal_values_in_ore_deposits Sharp, W.E., 1976. A log-normal distribution of alluvial diamonds with an economic cutoff. Economic Geology, 71: 648-655. doi: 10.2113/gsecongeo.71.3.648 Singer, D.A., 1993. Basic concepts in three-part quantitative assessments of undiscovered mineral resources. Nonrenewable Resources, 2(2): 69-81. doi: 10.1007/BF02272804 Singer, D.A., Berger, V.I., Moring, B.C., 2008. Porphyry copper deposits of the world: database, map, and grade and tonnage models, 2008. U.S. Geological Survey Open-File Report 2008-1155. http://pubs.usgs.gov/of/2008/1155/. Singer, D.A., Berger, V.I., Moring, B.C., 2009. Sediment-hosted zinc-lead deposits of the world: database and grade and tonnage models. U.S. Geological Survey Open-File Report 2009-1252. http://pubs.usgs.gov/of/2009/1252/. Singer, D.A., Menzie, W.D., 2010. Quantitative mineral resource assessments—an integrated approach. Oxford University Press, New York, 232. Slichter, L.B., Dixon, W.J., Meyer, G.H., 1962. Statistics as a guide to prospecting. In: Proc. Symposium Mathematical and Computer Applications in Mining and Exploration. College of Mines, University of Arizona, Tucson, AZ, F1-1-F-1-27. Stuart, A., Ord, J.K., 1991. Kendall's advanced theory of statistics, v. 2, 5th ed. . Oxford University Press, New York, 1323. Zhang, Q.L., Shoji, Tetsuya, Kaneda, Hiroaki, 2004. Grade-tonnage models of copper deposits in China. Shigen-to-Sozai, The Mining and Materials Processing Institute of Japan, 120: 19-24. -

 点击查看大图
计量
- 文章访问数: 3126
- HTML全文浏览量: 416
- PDF下载量: 61
- 被引次数: 0
