


Application of Geochemical Data in Analysis of Geological Background and Metallogenic Conditions: A Case Study of Northwest China
-
摘要: 1:5万矿产地质调查中通常会优先部署地球化学调查工作,采样密度一般大于8点/km2,并分析多达38项地球化学指标,其主要目的是发现"矿致异常",指导矿产勘查工作.而研究表明,区域地球化学数据是地表物质化学组成的直接反映,所以不仅包含了与成矿有关的异常信息,更包含了丰富的地质信息.在本次工作中应用中国西北干旱荒漠景观区1:5万地球化学调查数据成功识别了工作区地质体单元的分布.相比1:20万地质底图,通过clr-PCA分析提取出的1:5万地球化学数据信息展现了更多的细节:(1)地质体单元可以更为细致地划分为多个次级单元;(2)侵入体单元可以进行期次或岩相划分;(3)可为地质体单元的归属提供依据.本项研究结果成功指导了后续开展的1:5万地质调查工作,并对最终的1:5万地质图进行了验证,此外还提供了多处有利找矿线索.Abstract: In most 1:50 000 geological and mineral surveys, geochemical surveys are conducted first and sampling density is higher than 8 samples/km2, with up to 38 geochemical indices being analyzed, because the main purpose is to identify "ore causing anomalies" and to facilitate mineral exploration. However, it has been found in previous studies that regional geochemical data directly reflect the chemical composition of surface materials, which contain more extensive geological information than mere anomalies related to mineralization. Based on 1:50 000 geochemical surveys of arid desert landscapes in Northwest China. Geological units in the working area and their geochemical characteristics were studied and identified in this study. Compared to 1:200 000 geological maps, the results of the PC analysis performed on clr-transformed 1:50 000 geochemical data show more details:(1) some geological units could be further divided into multiple sub-units; (2) some intrusive rocks could be divided by phases or lithofacies characteristics; (3) could provide clues for the classification of geological units. The results of this study have been successfully used in the follow-up 1:50 000 geological mapping and verification of the final 1:50 000 geological map. Furthermore, the division of geological units and the identification of geochemical characteristics could provide information for excluding the geochemical anomalies which are irrelevant to mineralization.
-
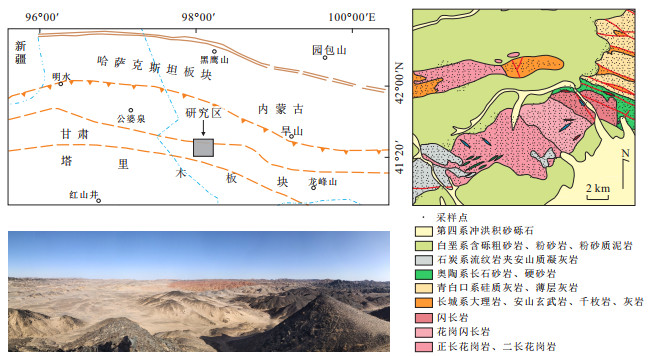
图 1 研究区地质简图及采样点位置、工作区地貌景观特征
地质底图来源:甘肃省地质局第二区域地质测量队(1972)石板井幅1:20万地质图
Fig. 1. Geological setting of study area and location of samples with 1:200 000 geological map, and landscape photograph
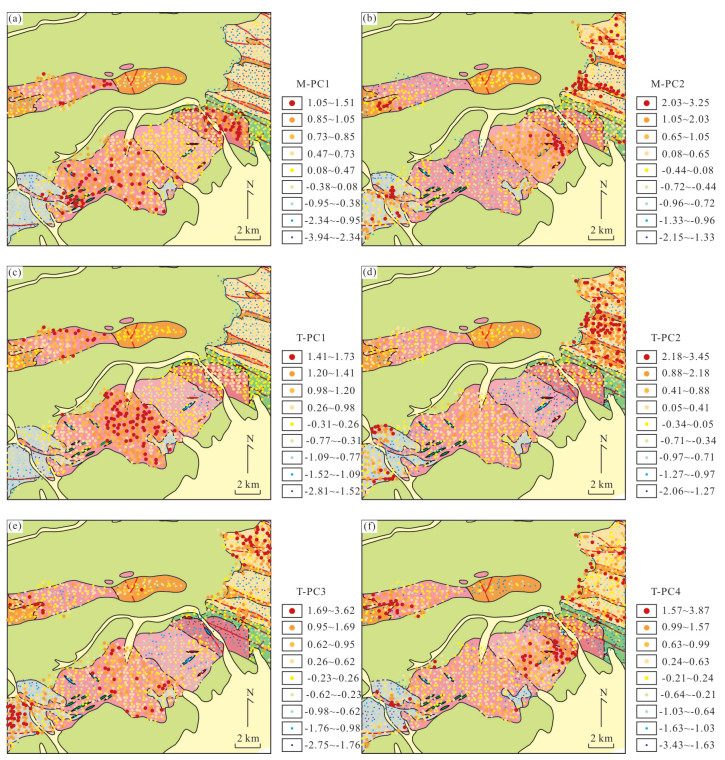
图 4 主成分分析主成分得分点位符号图
梯度界线采用累积频率方法确定(0%-5%-15%-25%-40%-60%-75%-85%-95%-100%).a.常量组分PC1得分(M-PC1);b.常量组分PC2得分(M-PC2);c.微量元素PC1得分(T-PC1),d.微量元素PC2得分(T-PC2),e.微量元素PC3得分(T-PC3),f.微量元素PC4得分(T-PC4).地质图例同图 1
Fig. 4. Samples symbol images of PC scores of clr-transformed data with 1:200 000 geological map
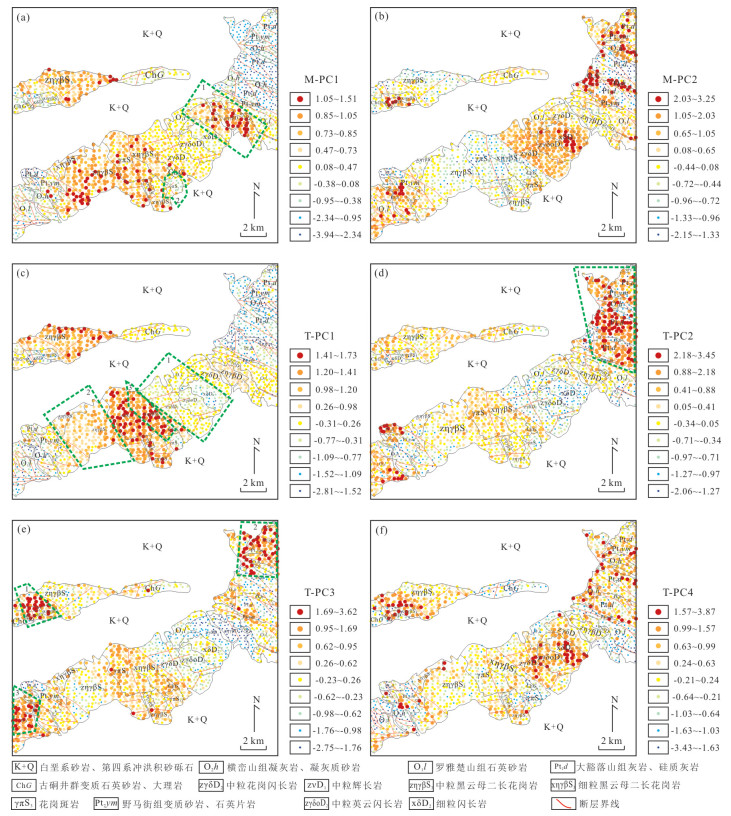
图 5 主成分分析主成分得分点位符号
注释同图 4;地质底图来源中国地质科学院地球物理地球化学勘查研究所编制,尚未正式出版
Fig. 5. Samples symbol images of PC scores of clr-transformed data with 1:50 000 geological map
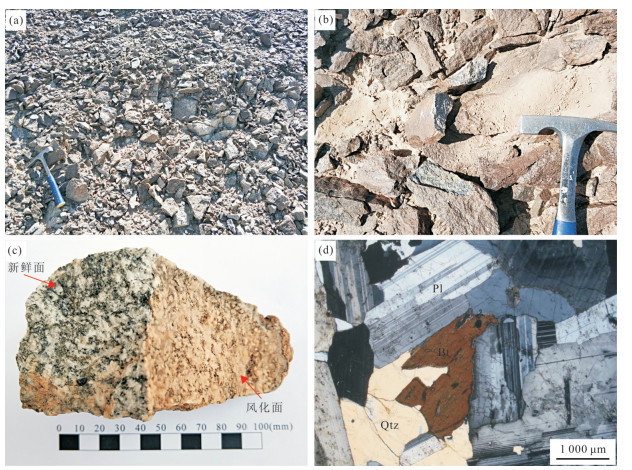
图 6 英云闪长岩野外露头、标本、薄片镜下照片
a, b.英云闪长岩野外露头照片;c.英云闪长岩手标本照片;d.英云闪长岩薄片镜下照片
Fig. 6. Field photographs and micrographs of tonalite
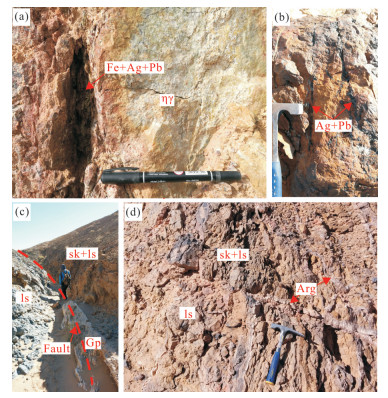
图 8 矿化露头照片
a, b.银铅多金属矿化露头;c, d.矽卡岩化、褐铁矿化. Fe+Ag+Pb.铁银铅矿化;ηγ.二长花岗岩;Ag+Pb.银铅矿化;sk.矽卡岩化;ls.灰岩;Gp.文石;Arg.粘土化
Fig. 8. Photographs of metallization
表 1 35个元素的分析方法及方法检出限
Table 1. The analytical methods and detection limits for 35 elements
元素 分析方法 检出限 SiO2 XRF 0.05 Al2O3 XRF 0.02 TFe2O3 XRF 0.02 MgO XRF 0.02 CaO XRF 0.02 Na2O XRF 0.04 K2O XRF 0.03 TiO2 XRF 0.02 Ag ICP-AES 0.016 As AFS 0.5 Au AAS 0.2 Ba ICP-AES 5 Be ICP-MS 0.08 Co ICP-MS 0.23 Cr ICP-MS 1.8 Cu ICP-MS 0.29 Cs ICP-MS 0.05 La ICP-MS 0.1 Li ICP-0ES 0.9 Mo ICP-MS 0.1 Mn ICP-MS 4 Ni ICP-MS 0.26 Pb ICP-MS 0.3 Rb ICP-MS 0.5 S XRF 50 Sb AFS 0.04 Sc ICP-MS 0.2 Sn ICP-AES 0.7 Sr ICP-AES 1 Th ICP-MS 0.3 U ICP-MS 0.04 V ICP-AES 4 W ICP-MS 0.11 Zn ICP-MS 0.3 Zr ICP-MS 0.6 注:①元素检出限的单位说明,SiO2、Al2O3、TFe2O3、MgO、CaO、Na2O、K2O、TiO2为%,Au为ng/g,其他元素为μg/g.②分析技术方法说明,XRF.熔片制样X射线荧光光谱法;AFS.原子荧光光谱法;ICP-MS.电感耦合等离子体质谱法;ICP-AES.电感耦合等离子体发射光谱法.  下载: 导出CSV
表 2 常量组分主成分分析结果
Table 2. Principal components of the origin and clr-transformed major oxide data
常量组分 原始数据 clr变换数据 PC1 PC2 PC1 PC2 TiO2 0.002 0.962 -0.219 0.938 SiO2 0.930 -0.096 0.865 0.021 Al2O3 0.892 0.302 0.888 0.340 TFe2O3 0.023 0.957 -0.170 0.939 MgO -0.630 0.330 -0.854 0.215 CaO -0.932 -0.165 -0.814 -0.215 K2O 0.791 -0.398 0.931 -0.214 Na2O 0.715 0.232 0.741 0.342 特征值 4.06 2.29 4.42 2.13 方差解释率(%) 50.80 28.62 55.26 26.68 解释方差总和(%) 50.80 79.42 55.26 81.14
下载: 导出CSV
表 3 clr变换主成分分析结果解释
Table 3. Explanation of the two principal components extracted from the clr-transformed major oxide data
方差解释率(%) 组合关系 解释 55.26 ①MgO-CaO ①、②分别对应碳酸盐岩与花岗岩,元素组合呈现显著的反相关关系 ②SiO2-Al2O3-Na2O-K2O 26.68 ①TFe2O3-TiO2-(Na2O) TFe2O3-TiO2可能与中基性火山岩地层或侵入岩有关,也与部分矿化作用相关;而Na2O-K2O的对应与花岗岩的类型相关,CaO与碳酸盐岩相关 ②K2O-CaO
下载: 导出CSV
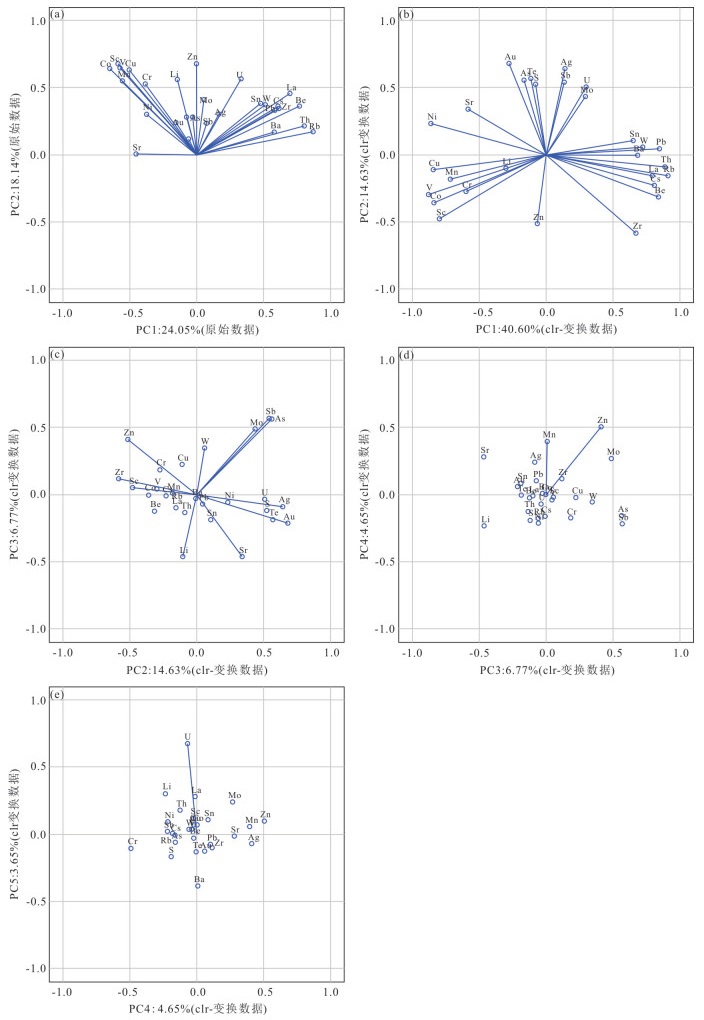
表 4 微量元素主成分分析结果
Table 4. Principal components of the origin and clr-transformed trace element data
元素 原始数据 clr变换数据 PC1 PC2 PC3 PC4 PC5 PC6 PC7 PC1 PC2 PC3 PC4 PC5 Au -0.16 0.24 0.44 0.03 -0.04 0.35 -0.21 -0.28 0.68 -0.21 0.06 -0.13 Ag 0.17 0.30 0.58 -0.50 0.34 -0.16 0.03 0.14 0.64 -0.09 0.21 -0.07 As -0.03 0.28 0.49 0.22 -0.08 0.40 -0.19 -0.17 0.56 0.56 -0.16 -0.06 Ba 0.58 0.17 0.03 -0.07 -0.05 0.32 -0.19 0.68 -0.01 -0.03 0.01 -0.39 Be 0.77 0.36 -0.22 0.08 -0.04 -0.02 0.03 0.84 -0.32 -0.12 -0.02 -0.03 Co -0.65 0.64 -0.26 -0.06 0.05 0.03 -0.03 -0.84 -0.36 0.00 0.00 0.07 Cr -0.38 0.53 -0.14 0.30 0.58 0.13 0.05 -0.60 -0.28 0.19 -0.19 -0.11 Cs 0.61 0.36 -0.22 0.07 -0.03 0.07 -0.03 0.81 -0.23 -0.01 -0.16 -0.01 Cu -0.50 0.63 -0.03 -0.01 -0.15 -0.09 -0.13 -0.84 -0.11 0.22 -0.02 0.07 La 0.70 0.46 -0.16 0.11 -0.14 -0.02 0.12 0.79 -0.16 -0.10 -0.01 0.08 Li -0.15 0.56 -0.27 0.05 -0.11 0.09 -0.01 -0.30 -0.10 -0.46 -0.23 0.30 Mn -0.55 0.55 -0.17 -0.23 -0.16 0.05 0.02 -0.72 -0.18 0.01 0.39 0.06 Mo 0.05 0.41 0.42 0.30 -0.09 -0.57 -0.02 0.29 0.43 0.49 0.27 0.24 Ni -0.37 0.30 -0.11 0.34 0.71 0.11 0.11 -0.86 0.23 -0.06 -0.22 0.09 Pb 0.58 0.33 0.27 -0.37 0.20 0.02 0.06 0.85 0.04 -0.07 0.10 -0.08 Rb 0.87 0.17 -0.15 0.15 0.03 0.06 -0.05 0.91 -0.16 -0.06 -0.18 0.00 S -0.06 0.12 0.38 0.24 -0.15 0.37 0.57 -0.08 0.52 -0.12 -0.19 -0.17 Sb 0.07 0.23 0.39 0.28 0.00 -0.21 -0.41 0.13 0.54 0.57 -0.22 0.02 Sc -0.59 0.68 -0.25 -0.12 -0.14 0.06 -0.06 -0.80 -0.48 0.05 -0.02 0.12 Sn 0.48 0.38 -0.11 0.00 0.15 -0.13 0.09 0.65 0.11 -0.19 0.08 0.11 Sr -0.45 0.00 0.20 -0.04 -0.16 -0.11 0.53 -0.58 0.34 -0.46 0.28 -0.01 Te -0.08 0.28 0.32 0.26 -0.28 0.24 -0.07 -0.12 0.57 -0.19 0.00 -0.13 Th 0.80 0.21 -0.18 0.19 -0.03 -0.04 0.06 0.89 -0.09 -0.13 -0.13 0.18 U 0.33 0.56 0.15 0.33 -0.14 -0.26 0.24 0.30 0.50 -0.04 -0.07 0.67 V -0.57 0.65 -0.02 -0.03 -0.15 -0.21 -0.13 -0.88 -0.30 0.04 -0.04 0.04 W 0.51 0.37 0.29 -0.28 0.24 -0.03 0.00 0.72 0.06 0.35 -0.06 0.04 Zn 0.00 0.68 0.06 -0.41 -0.07 0.12 0.15 -0.07 -0.51 0.41 0.50 0.10 Zr 0.62 0.35 -0.22 -0.17 -0.13 0.11 -0.01 0.67 -0.58 0.12 0.12 -0.10 特征值 6.73 5.08 2.07 1.48 1.38 1.20 1.06 11.36 4.10 1.89 1.30 1.02 方差解释率(%) 24.05 18.14 7.40 5.30 4.93 4.29 3.77 40.60 14.63 6.77 4.65 3.65 解释方差总和(%) 24.05 42.19 49.58 54.89 59.82 64.11 67.88 40.60 55.23 62.00 66.65 70.30
下载: 导出CSV
-
Aitchison, J., 1986.Statistical Analysis of Compositional Data. Chapman and Hall, London-New York, 416. http://doi.wiley.com/10.1002/bimj.4710300705 Ao, S.J., Xiao, W.J., Han, C.M., et al., 2012.Cambrian to Early Silurian Ophiolite and Accretionary Processes in the Beishan Collage, NW China:Implications for the Architecture of the Southern Altaids. Geological Magazine, 149(4):606-625. https://doi.org/10.1017/s0016756811000884 doi: 10.1017/S0016756811000884 Bradshaw, P.M.D., Lett, R.E.W., 1980.Geochemical Exploration for Uranium Using Soils. Journal of Geochemical Exploration, 13(2-3):305-319. https://doi.org/10.1016/0375-6742(80)90011-4 Buccianti, A., Grunsky, E.C., 2014.Compositional Data Analysis in Geochemistry:Are We Sure to See what Really Occurs during Natural Processes?.Journal of Geochemical Exploration, 141:1-5. https://doi.org/10.1016/j.gexplo.2014.03.022 Carranza, E.J.M., 2011.Analysis and Mapping of Geochemical Anomalies Using Logratio-Transformed Stream Sediment Data with Censored Values. Journal of Geochemical Exploration, 110(2):167-185. https://doi.org/10.1016/j.gexplo.2011.05.007 Chayes, F., Trochimczyk, J., 1978.An Effect of Closure on the Structure of Principal Components. Journal of the International Association for Mathematical Geology, 10(4):323-333. https://doi.org/10.1007/bf01031737 doi: 10.1007/BF01031737 Chork, C.Y., 1990.Unmasking Multivariate Anomalous Observations in Exploration Geochemical Data from Sheeted-Vein Tin Mineralization near Emmaville, N.S.W., Australia. Journal of Geochemical Exploration, 37(2):205-223. https://doi.org/10.1016/0375-6742(90)90027-8 Egozcue, J.J., Pawlowsky-Glahn, V., 2005.Groups of Parts and Their Balances in Compositional Data Analysis. Mathematical Geology, 37(7):795-828. https://doi.org/10.1007/s11004-005-7381-9 Egozcue, J.J., Pawlowsky-Glahn, V., Mateu-Figueras, G., et al., 2003.Isometric Logratio Transformations for Compositional Data Analysis. Mathematical Geology, 35(3):279-300. https://doi.org/10.1023/A:1023818214614 http://www.wanfangdata.com.cn/details/detail.do?_type=perio&id=aef9451dad86baecd99f49b41a583780 Esbensen, K.H., Steenfelt, A., 1989.Geochemical Prospecting in Complex Sample Media-Multivariate Data Analysis of Indirect Observations (PLS-Regression between Modal Mineralogy and Geochemistry). Journal of Geochemical Exploration, 32(1-3):345-347. https://doi.org/10.1016/0375-6742(89)90073-3 Fan, H.K., Wen, Y.W., Jiang, X.Y., et al., 2008.Geochemical Debris Exploration Method and Its Effect in the Semi-Arid Desert and Grassland Area, East-Central Inner Mongolia.Geology and Prospecting, 44(5):64-69(in Chinese with English abstract). http://cn.bing.com/academic/profile?id=63b73490e2666a09d73d407dab6a1c32&encoded=0&v=paper_preview&mkt=zh-cn Filzmoser, P., 2016. Identification of Multivariate Outliers:A Performance Study. Austrian Journal of Statistics, 34(2):127. https://doi.org/10.17713/ajs.v34i2.406 Filzmoser, P., Hron, K., 2009. Correlation Analysis for Compositional Data. Mathematical Geosciences, 41(8):905-919. https://doi.org/10.1007/s11004-008-9196-y Filzmoser, P., Hron, K., Reimann, C., 2010.The Bivariate Statistical Analysis of Environmental (Compositional) Data. Science of the Total Environment, 408(19):4230-4238. https://doi.org/10.1016/j.scitotenv.2010.05.011 http://www.wanfangdata.com.cn/details/detail.do?_type=perio&id=64a3cde671fdbc9c60aff884df1c8620 Govett, G.J.S., 1983.Rock Geochemistry in Mineral Exploration. Elsevier Scientific Publishing Company, New York. Grunsky, E.C., de Caritat, P., Mueller, U.A., 2017.Using Surface Regolith Geochemistry to Map the Major Crustal Blocks of the Australian Continent. Gondwana Research, 46:227-239. https://doi.org/10.1016/j.gr.2017.02.011 Grunsky, E.C., Mueller, U.A., Corrigan, D., 2014.A Study of the Lake Sediment Geochemistry of the Melville Peninsula Using Multivariate Methods:Applications for Predictive Geological Mapping. Journal of Geochemical Exploration, 141:15-41. https://doi.org/10.1016/j.gexplo.2013.07.013 Grunsky, E.C., 2010.The Interpretation of Geochemical Survey Data. Geochemistry:Exploration, Environment, Analysis, 10(1):27-74. https://doi.org/10.1144/1467-7873/09-210 Harris, J.R., Grunsky, E.C., 2015.Predictive Lithological Mapping of Canada's North Using Random Forest Classification Applied to Geophysical and Geochemical Data. Computers & Geosciences, 80:9-25. https://doi.org/10.1016/j.cageo.2015.03.013 http://www.wanfangdata.com.cn/details/detail.do?_type=perio&id=bd214107d50e9bfd6d49a75911dd3630 Hron, K., Templ, M., Filzmoser, P., 2010.Imputation of Missing Values for Compositional Data Using Classical and Robust Methods. Computational Statistics & Data Analysis, 54(12):3095-3107. https://doi.org/10.1016/j.csda.2009.11.023 http://www.wanfangdata.com.cn/details/detail.do?_type=perio&id=c491c98e0ae3ba9f54f5b3420f1e857a Kang, M., Cen, K., Wu, Y.B., et al., 2004.1:50 000 Geochemical Prospecting Methods and Techniques in Gobi Desert Landscape in the Beishan Area, Northwestern China. Geology and Prospecting, 40(3):64-68(in Chinese with English abstract). http://d.old.wanfangdata.com.cn/OAPaper/oai_doaj-articles_312d799abfb4a74ea247d6e73a15df1a Liu, X.C., Wang, W.L., Pei, Y.R., et al., 2017.Quantitative Analysis and Interpretation of the Geochemical Data of the Stream Sediment in Duolong Mineral District, Tibet, China.Journal of Geomechanics, 23(5):695-706(in Chinese with English abstract). http://www.wanfangdata.com.cn/details/detail.do?_type=perio&id=dzlxxb201705007 Loughlin, W.P., 1991.Principal Component Analysis for Alteration Mapping. Photogrammetric Engineering and Remote Sensing, (57):1163-1169. http://cn.bing.com/academic/profile?id=28fa28cdcc527c83495be63802223b42&encoded=0&v=paper_preview&mkt=zh-cn Martín-Fernández, J.A., Hron, K., Templ, M., et al., 2012.Model-Based Replacement of Rounded Zeros in Compositional Data:Classical and Robust Approaches. Computational Statistics & Data Analysis, 56(9):2688-2704. https://doi.org/10.1016/j.csda.2012.02.012 http://cn.bing.com/academic/profile?id=fdaffd71876c0374c7497ceb3b70f4a1&encoded=0&v=paper_preview&mkt=zh-cn McKinley, J.M., Hron, K., Grunsky, E.C., et al., 2016.The Single Component Geochemical Map:Fact or Fiction?.Journal of Geochemical Exploration, 162:16-28. https://doi.org/10.1016/j.gexplo.2015.12.005 McNeal, J.M., Lee, D.E., Millard, H.T. Jr, 1981.The Distribution of Uranium and Thorium in Granitic Rocks of the Basin and Range Province, Western United States. Journal of Geochemical Exploration, 14:25-40. https://doi.org/10.1016/0375-6742(81)90101-1 Ministry of Land and Resources of the People's Republic of China, 2015, Specification of Geochemical Reconnaissance Survey(1:50 000). Geological Publishing House, Beijing. Murali, A.V., Parthasarathy, R., Mahadevan, T.M., et al., 1983.Trace Element Characteristics, REE Patterns and Partition Coefficients of Zircons from Different Geological Environments-A Case Study on Indian Zircons. Geochimica et Cosmochimica Acta, 47(11):2047-2052. https://doi.org/10.1016/0016-7037(83)90220-x doi: 10.1016/0016-7037(83)90220-X Reimann, C., Filzmoser, P., Fabian, K., et al., 2012. The Concept of Compositional Data Analysis in Practice-Total Major Element Concentrations in Agricultural and Grazing Land Soils of Europe. Science of the Total Environment, 426:196-210. https://doi.org/10.1016/j.scitotenv.2012.02.032 Sadeghi, M., Billay, A., Carranza, E.J.M., 2015.Analysis and Mapping of Soil Geochemical Anomalies:Implications for Bedrock Mapping and Gold Exploration in Giyani Area, South Africa. Journal of Geochemical Exploration, 154:180-193. https://doi.org/10.1016/j.gexplo.2014.11.018 Shepherd, A., Harvey, P.K., Leake, R.C., 1987.The Geochemistry of Residual Soils as an Aid to Geological Mapping:A Statistical Approach. Journal of Geochemical Exploration, 29(1-3):317-331. https://doi.org/10.1016/0375-6742(87)90084-7 Shi, Y.X., Hao, L.B., Lu, J.L., et al., 2008.Application of Factor Classification in Geological Mapping in Tahe Area, Heilongjiang Province. Journal of Jilin University(Earth Science Edition), 38(5):899-903(in Chinese with English abstract). http://www.wanfangdata.com.cn/details/detail.do?_type=perio&id=cckjdxxb200805030 Steenfelt, A., 1987.Geochemical Mapping and Prospecting in Greenland-A Review of Results and Experience. Journal of Geochemical Exploration, 29(1-3):183-205. https://doi.org/10.1016/0375-6742(87)90077-x doi: 10.1016/0375-6742(87)90077-X Tingley, J.V., Castor, S.B., 1999.Stream Sediment Exploration for Gold and Silver in Nevada-Application of an Old Prospecting Method Using Modern Analytical Techniques. Journal of Geochemical Exploration, 66(1-2):1-16. https://doi.org/10.1016/s0375-6742(99)00013-8 doi: 10.1016/S0375-6742(99)00013-8 Tukey, J.W., 1977.Exploratory Data Analysis. Addison-Wesley, Massachusetts. Wan, H.Q., Sun, H., Liu, H.Y., et al., 2015.Lithium Isotopic Geochemistry in Subduction Zones:Retrospects and Prospects. Earth Science Frontiers, 22(5):29-43(in Chinese with English abstract). http://d.old.wanfangdata.com.cn/Periodical/dxqy201505002 Wang, W.L., Zhao, J., Cheng, Q.M., 2014.Mapping of Fe Mineralization-Associated Geochemical Signatures Using Logratio Transformed Stream Sediment Geochemical Data in Eastern Tianshan, China. Journal of Geochemical Exploration, 141:6-14. https://doi.org/10.1016/j.gexplo.2013.11.008 Wang, Z.Y., Dong, Y.N., Zuo, R.G., 2019.Mapping Geochemical Anomalies Related to Fe-Polymetallic Mineralization Using the Maximum Margin Metric Learning Method. Ore Geology Reviews, 107:258-265. https://doi.org/10.1016/j.oregeorev.2019.02.027 http://cn.bing.com/academic/profile?id=2cdd896c14134332c101176dcde66179&encoded=0&v=paper_preview&mkt=zh-cn Wang, J., Zuo, R.G., 2019.Recognizing Geochemical Anomalies via Stochastic Simulation-Based Local Singularity Analysis. Journal of Geochemical Exploration, 198:29-40. https://doi.org/10.1016/j.gexplo.2018.12.012 Wu, J., Bu, J.J., Xie, G.G., et al., 2016.Application of Regional Geochemical Data in Geological Mapping in Strongly Weathered Area in Southern China.Journal of Geomechanics, 22(4):955-966(in Chinese with English abstract). http://www.wanfangdata.com.cn/details/detail.do?_type=perio&id=dzlxxb201604013 Xiang, Y.C., Gong, Q.J., Liu, R.M., et al., 2014.Model and Application of Deducing Geological Body on Regional Geochemical Survey Data:A Case Study on Granitic Intrusions in China. Acta Petrologica Sinica, 30(9):2609-2618(in Chinese with English abstract). http://d.old.wanfangdata.com.cn/Periodical/ysxb98201409012 Xiong, Y.H., Zuo, R.G., 2016.Recognition of Geochemical Anomalies Using a Deep Autoencoder Network. Computers & Geosciences, 86:75-82. https://doi.org/10.1016/j.cageo.2015.10.006 http://www.wanfangdata.com.cn/details/detail.do?_type=perio&id=f659583bb053f79afe258c22bcc05d8a Xiong, Y.H., Zuo, R.G., Carranza, E.J.M., 2018.Mapping Mineral Prospectivity through Big Data Analytics and a Deep Learning Algorithm. Ore Geology Reviews, 102:811-817. https://doi.org/10.1016/j.oregeorev.2018.10.006 Xu, W., Xu, X. Y., Lu, J. C., et al., 2019.Geochronology, Petrogenesis and Tectonic Implications of Devonian High-K Acid Magmatic Rocks from Yemajing Area in Beishan Orogen. Earth Science, 44(8):2775-2793 (in Chinese with English abstract). http://www.wanfangdata.com.cn/details/detail.do?_type=perio&id=dqkx201908021 Yousefi, M., Carranza, E.J.M., Kamkar-Rouhani, A., 2013.Weighted Drainage Catchment Basin Mapping of Geochemical Anomalies Using Stream Sediment Data for Mineral Potential Modeling. Journal of Geochemical Exploration, 128:88-96. https://doi.org/10.1016/j.gexplo.2013.01.013 Zeng, L., Cheng, L.L., Cheng, Q.M., et al., 2014.A Refinement of Lange's Plagioclase-Liquid Hygrometer/Thermometer Based on Quadratic Log-Contrast Models for Experiments with Mixtures. Journal of Geochemical Exploration, 141:89-99. https://doi.org/10.1016/j.gexplo.2013.12.008 Zhao, J.N., Chen, S.Y., Zuo, R.G., 2017.Identification and Mapping of Lithogeochemical Signatures Using Staged Factor Analysis and Fractal/Multifractal Models. Geochemistry:Exploration, Environment, Analysis, 17(3):239-251. https://doi.org/10.1144/geochem2016-013 Zhong, F.J., Pan, J.Y., Wu, J.H., et al., 2019. Petrogenesis and Its Relationship with Uranium Mineralization of Gabbro-Diorite in Changjiang Uranium Ore-Field, Northern Guangdong Province, China. Earth Science, 44(9):3042-3059 (in Chinese with English abstract). http://d.old.wanfangdata.com.cn/Periodical/dqkx201909018 Zhou, D., 1998.Geological Compositional Data Analysis:Difficulties and Solutions.Earth Science, 23(2):41-46(in Chinese with English abstract). http://d.old.wanfangdata.com.cn/Periodical/dqkx199802009 Zuo, R.G., 2017.Machine Learning of Mineralization-Related Geochemical Anomalies:A Review of Potential Methods. Natural Resources Research, 26(4):457-464. https://doi.org/10.1007/s11053-017-9345-4 Zuo, R.G., Xia, Q.L., Wang, H.C., 2013.Compositional Data Analysis in the Study of Integrated Geochemical Anomalies Associated with Mineralization. Applied Geochemistry, 28:202-211. https://doi.org/10.1016/j.apgeochem.2012.10.031 Zuo, R.G., Xiong, Y.H., 2018.Big Data Analytics of Identifying Geochemical Anomalies Supported by Machine Learning Methods. Natural Resources Research, 27(1):5-13. https://doi.org/10.1007/s11053-017-9357-0 Zuo, R.G., Xiong, Y.H., Wang, J., et al., 2019.Deep Learning and Its Application in Geochemical Mapping. Earth-Science Reviews, 192:1-14. https://doi.org/10.1016/j.earscirev.2019.02.023 Zuo, R.G., Zhang, Z.J., Zhang, D.J., et al., 2015. Evaluation of Uncertainty in Mineral Prospectivity Mapping Due to Missing Evidence:A Case Study with Skarn-Type Fe Deposits in Southwestern Fujian Province, China. Ore Geology Reviews, 71:502-515. https://doi.org/10.1016/j.oregeorev.2014.09.024 范红科, 温银维, 姜羡义, 等, 2008.内蒙古中东部半干旱荒漠草原景观区岩屑地球化学测量的方法技术及应用效果.地质与勘探, 44(5):64-69. http://d.old.wanfangdata.com.cn/Periodical/dzykt200805011 康明, 岑况, 吴悦斌, 等, 2004.北山戈壁荒漠景观1:5万地球化学测量方法研究.地质与勘探, 40(3):64-68. doi: 10.3969/j.issn.0495-5331.2004.03.014 刘向冲, 王文磊, 裴英茹, 等, 2017.西藏多龙矿集区水系沉积物地球化学数据定量分析与解释.地质力学学报, 23(5):695-706. doi: 10.3969/j.issn.1006-6616.2017.05.007 时艳香, 郝立波, 陆继龙, 等, 2008.因子分类法在黑龙江塔河地区地质填图中的应用.吉林大学学报(地球科学版), 38(5):899-903. http://d.old.wanfangdata.com.cn/Periodical/cckjdxxb200805030 万红琼, 孙贺, 刘海洋, 等, 2015.俯冲带Li同位素地球化学:回顾与展望.地学前缘, 22(5):29-43. http://d.old.wanfangdata.com.cn/Periodical/dxqy201505002 吴俊, 卜建军, 谢国刚, 等, 2016.区域化探数据在华南强烈风化区地质填图中的应用.地质力学学报, 22(4):955-966. doi: 10.3969/j.issn.1006-6616.2016.04.013 向运川, 龚庆杰, 刘荣梅, 等, 2014.区域地球化学推断地质体模型与应用——以花岗岩类侵入体为例.岩石学报, 30(9):2609-2618. http://www.wanfangdata.com.cn/details/detail.do?_type=perio&id=ysxb98201409012 许伟, 徐学义, 卢进才, 等, 2019.北山野马井地区泥盆纪富钾酸性岩浆岩地球化学特征及其地质意义.地球科学, 44(8):2775-2793. doi: 10.3799/dqkx.2019.048 钟福军, 潘家永, 巫建华, 等, 2019.粤北长江铀矿田辉长闪长岩的岩石成因及其与铀成矿的关系.地球科学, 44(9):3042-3059. doi: 10.3799/dqkx.2017.592 中华人民共和国国土资源部, 2015.地球化学普查规范(1:50 000).北京:地质出版社. 周蒂, 1998.地质成分数据统计分析——困难和探索.地球科学, 23(2):41-46. http://www.earth-science.net/article/id/626 -


 点击查看大图
计量
- 文章访问数: 2591
- HTML全文浏览量: 1115
- PDF下载量: 108
- 被引次数: 0
