


Simulation and Prediction of Extreme Temperature Indices in Yangtze and Yellow River Basins by CMIP5 Models
-
摘要: 为研究长江和黄河流域极端气温的变化特征,对耦合模式比较计划第5阶段22个大气环流模式数据进行精度评估、Delta降尺度并计算16个极端气温指标,采用可靠性集合平均方法对两流域历史和未来的极端气温进行预估.结果表明:除四川盆地外,两流域的观测值与REA(ensemble reliability average)值在空间上具有较好一致性;未来三个时期(2020s、2050s、2080s),典型浓度路径(Representative Concentration Pathways,RCP)4.5情景下指标变化趋势依次递减,RCP8.5情景下变化趋势逐渐递增;RCP4.5和RCP8.5情景下指标年际变化在21世纪40年代之前是相似的,但之后变化趋势差异增加;两流域的大多数指标呈现上升趋势,冬季趋势相较于其他季节更显著;两流域之间冷极端指标的差异大于暖极端指标.总的来说,两流域的暖极端事件将更加严重.
-
关键词:
- 极端气温 /
- coupled model intercomparison project phase 5(CMIP5) /
- 长江流域 /
- 黄河流域 /
- 水文地质
Abstract: To study the change characteristics of extreme temperature in the Yangtze and Yellow River basins,the output data from 22 general climate models (GCMs) of the coupled model intercomparison project phase 5 (CMIP5) were selected.The data were processed by accuracy evaluation and delta downscaling,then 16 extreme temperature indices were calculated based on these data. The ensemble reliability average (REA) results were selected for historical simulation and future prediction of extreme temperature over the two basins. The results show that the spatial characteristics of the observations are in good agreement with that of the REA values,except for the Sichuan basin. During the three periods(2020s,2050s,2080s) in future,the trends of the indices would continually decrease under the Representative Concentration Pathways (RCP) 4.5 scenario,while the trends of these indices would increase under the RCP8.5 scenario. The variation of the indices is similar before the 1940s under the RCP4.5 and RCP8.5 scenarios,however,the variation characteristics under RCP4.5 and RCP8.5 have a significant difference since the 1940s. In the future,most indices would show upward trends,especially in winter. Moreover,the difference of the cold extreme indices between the two basins are greater than the difference of the warm extreme indices.In general,warm extreme events in the Yangtze and Yellow River basins will be more serious in future. -
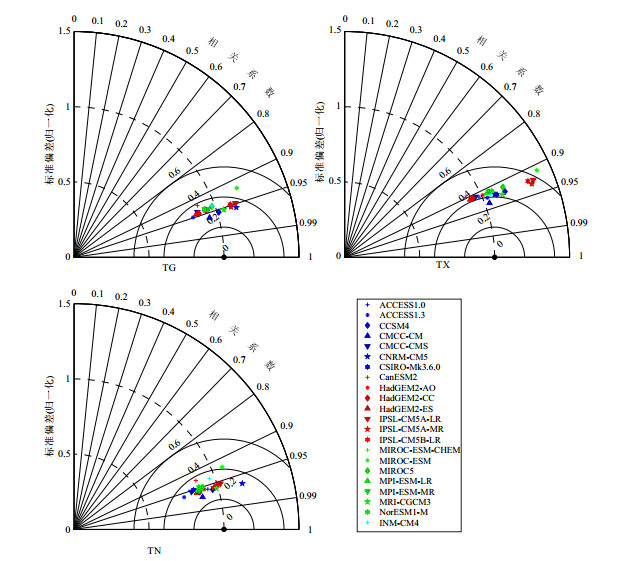
图 2 1961—2005年长江和黄河流域TG、TX和TN多年均值空间分布模拟结果
Fig. 2. Taylor diagrams for the spatial distribution of TG, TX and TN multi-year averages in the 1961 to 2005 over the Yangtze and Yellow River basins

图 3 2000—2005年CMIP5模式模拟的长江和黄河流域极端气温指标标准化RMSEs的色度图
Fig. 3. The "portrait" diagram of relative RMSEs of extreme temperature indices simulated by the CMIP5 models with respect to the observation in the 2000 to 2005 climatologies over the Yangtze and Yellow River basins
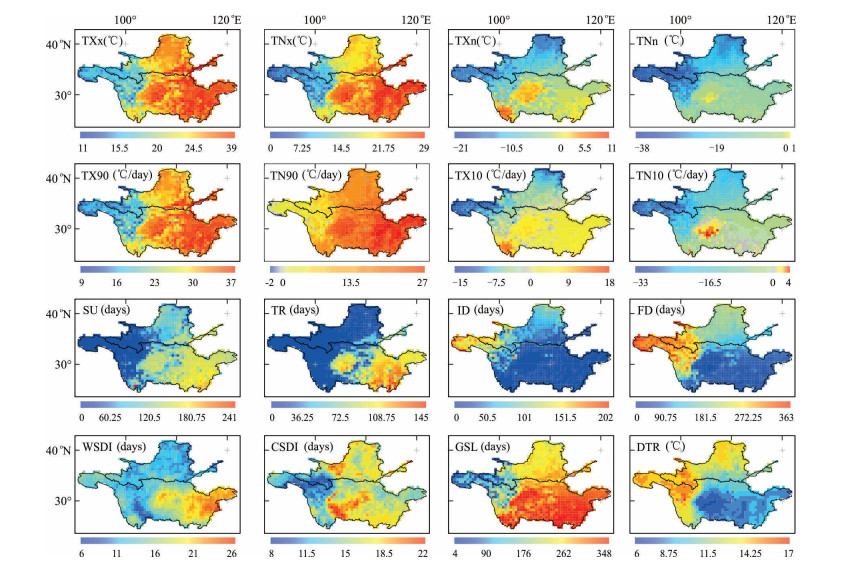
图 4 1961—1990年长江和黄河流域16个极端气温指标的观测值空间分布
图中左上角为图例的指标名称和单位(下图同)
Fig. 4. Spatial distribution of 16 extreme temperature indices for the observations in the 1961 to 1990 climatologies over the Yangtze and Yellow River basins
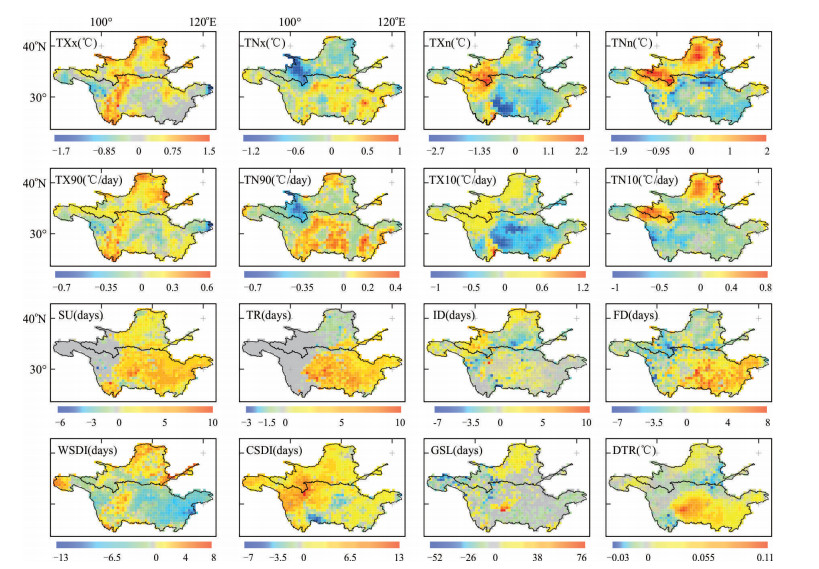
图 5 1961—1990年长江和黄河流域16个极端气温指标的REA值和观测值的偏差空间分布
Fig. 5. Bias between REA results and observations of 16 extreme temperature indices in the 1961 to 1990 climatologies over the Yangtze and Yellow River basins
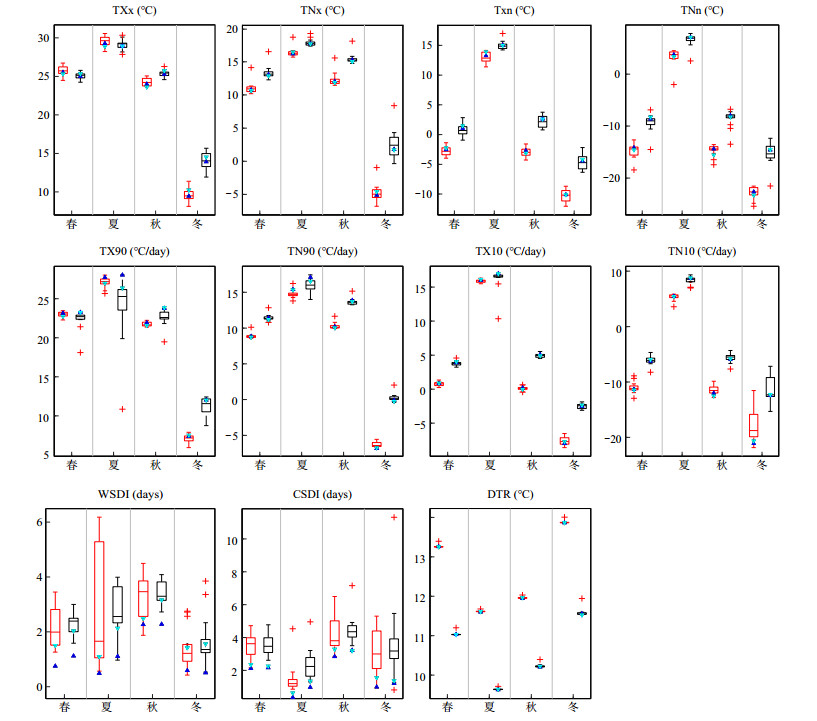
图 6 1961—1990年长江和黄河流域(分别为黑色和红色矩形盒)11个极端气温指标的季节均值盒须图
在每个矩形盒中,中心水平线表示中位数,底边和顶边分别对应第25个和第75个分位数.异常值标为“+”.多模式集合结果标为“▲”,观测结果标为“▼”;数值的指标名称和单位见图上方
Fig. 6. Box-and-whisker plots for the seasonal average of 11 extreme temperature indices from 1961 to 1990 over the Yangtze and Yellow River basins (black and red, respectively) on the basis of 14 GCMs
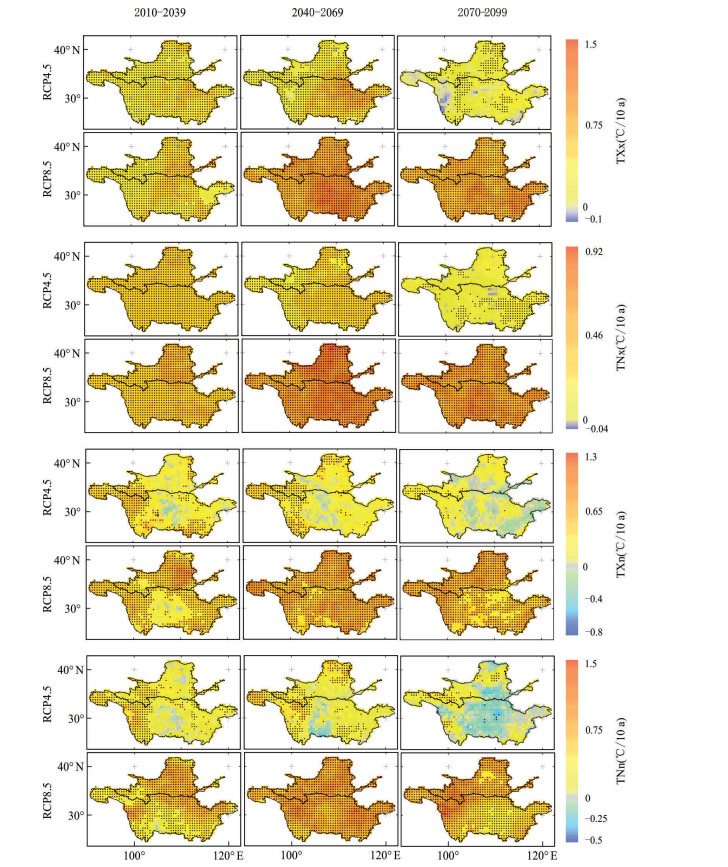
图 7 在RCP4.5和RCP8.5情景下,长江和黄河流域绝对指标REA值模拟的30年时期(2020s、2050s、2080s)趋势预测的空间分布
黑点表示趋势在95%的显著性水平上显著
Fig. 7. Spatial distribution of the predicted trends in the absolute indices for REA results for 30-year periods on the 2020s, 2050s, and 2080s under RCP4.5 and RCP8.5 (1st and 2nd rows, respectively) over the Yangtze and Yellow River basins
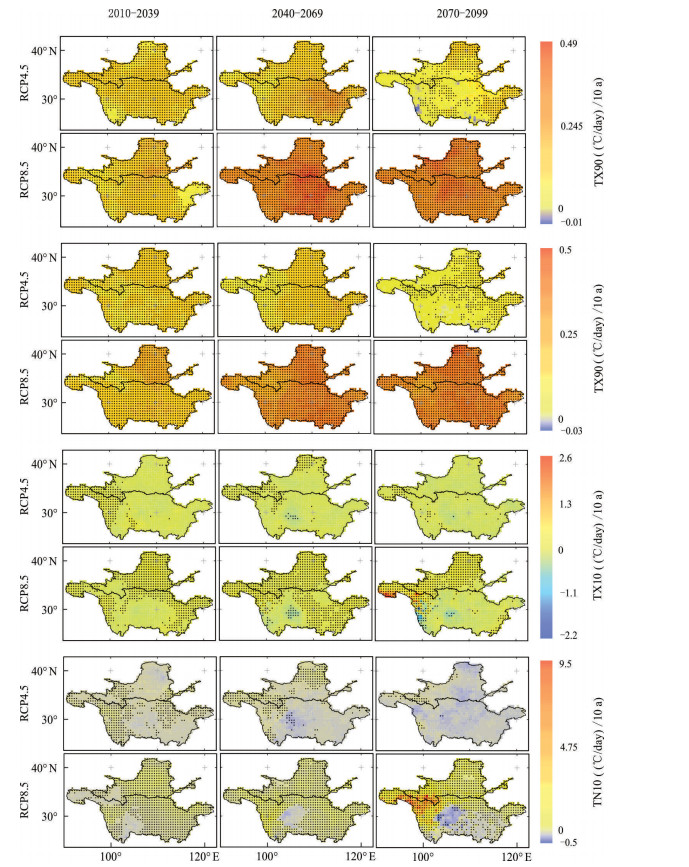
图 8 在RCP4.5和RCP8.5情景下,长江和黄河流域百分位指标REA值模拟的30年时期(2020s、2050s、2080s)趋势预测的空间分布
黑点表示趋势在95%的显著性水平上显著
Fig. 8. Spatial distribution of the predicted trends in the percentile indices for REA results for 30-year periods on the 2020s, 2050s and 2080s under RCP4.5 and RCP8.5 (1st and 2nd rows, respectively) over the Yangtze and Yellow River basins
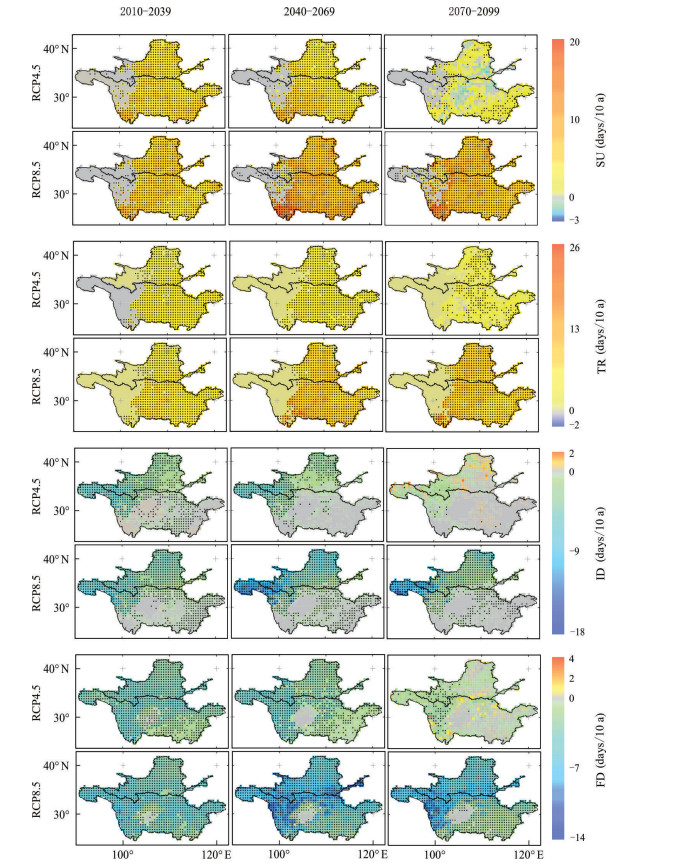
图 9 在RCP4.5和RCP8.5情景下,长江和黄河流域阈值指标REA值模拟的30年时期(2020s、2050s、2080s)趋势预测的空间分布
黑点表示趋势在95%的显著性水平上显著
Fig. 9. Spatial distribution of the predicted trends in the threshold indices for REA results for 30-year periods on the 2020s, 2050s and 2080s under RCP4.5 and RCP8.5 (1st and 2nd rows, respectively) over the Yangtze and Yellow River basins
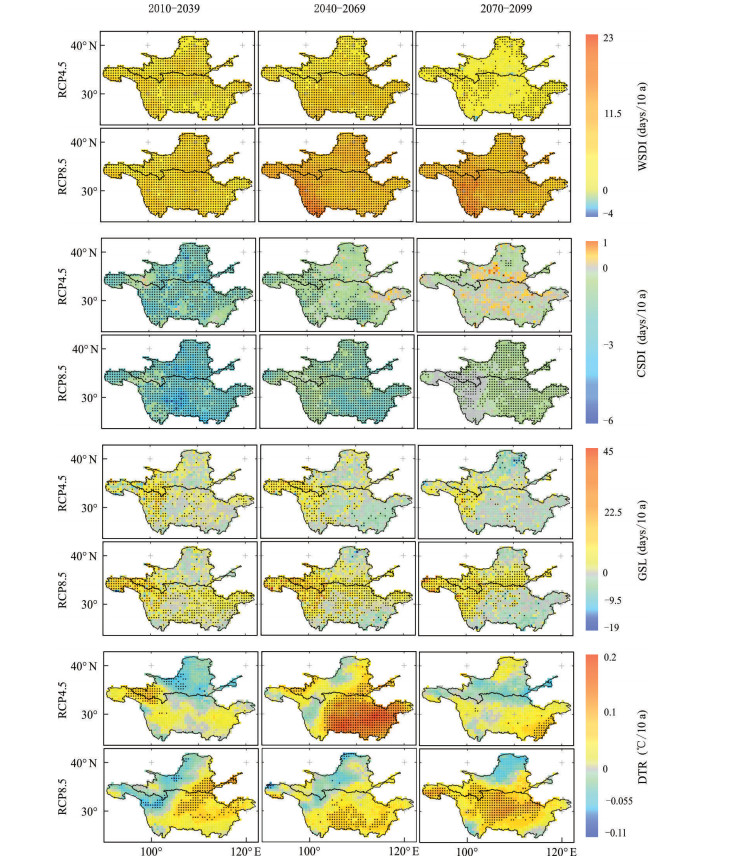
图 10 在RCP4.5和RCP8.5情景下,长江和黄河流域持续时间指标和范围指标的REA值模拟的30年时期(2020s、2050s、2080s)趋势预测的空间分布
黑点表示趋势在95%的显著性水平上显著
Fig. 10. Spatial distribution of the predicted trends in the duration indices and range indices for REA results for 30-year periods on the 2020s, 2050s and 2080s under RCP4.5 and RCP8.5 (1st and 2nd rows, respectively) over the Yangtze and Yellow River basins
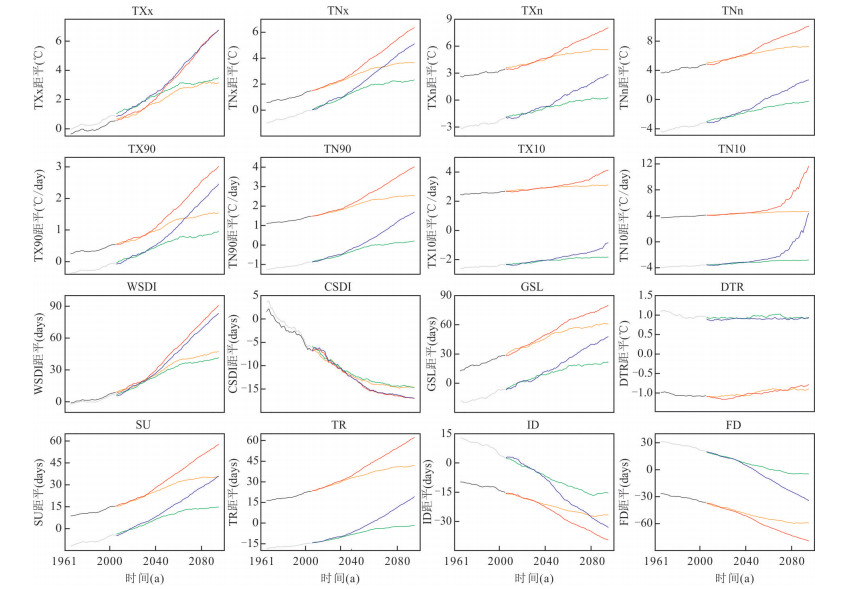
图 11 长江和黄河流域16个极端气温指标REA值的每年区域平均距平值(相对于参考期1961—1990年).在历史时期、RCP4.5和RCP8.5情景下,长江流域结果分别表示为黑色、橙色和红色,黄河流域结果分别表示为灰色、绿色和蓝色.时间序列使用11年滑动平均处理
Fig. 11. The annual regional mean anomalies of 16 extreme temperature indices simulated by REA results for history, RCP4.5 and RCP8.5 (black, orange, red for the Yangtze River basin, and gray, green, blue for the Yellow River basin) relative to the reference period 1961 to 1990. Time series are smoothed using an 11 year running mean filter

图 12 2006—2100年长江和黄河流域(分别为黑色和红色矩形盒)11个极端气温指标的季节趋势预测盒须图
在每个矩形盒中,中心水平线表示中位数,底边和顶边分别对应第25个和第75个分位数.异常值标为“+”.多模式集合结果标为“▲”; 数值的指标名称和单位见图上方
Fig. 12. Box-and-whisker plots for the seasonal predicted trend of 11 extreme temperature indices from 2006 to 2100 for RCP4.5 and RCP8.5 over the Yangtze and Yellow River basins (black and red, respectively), which are based on 14 GCMs ensemble
表 1 CMIP5中22个GCMs具体信息
Table 1. List of 22 GCMs used in this study
序号 模式名称 水平格点数(个) 研究机构 国家 1 ACCESS1.0 192×145 CSIRO-BOM 澳大利亚 2 ACCESS1.3 192×145 CSIRO-BOM 澳大利亚 3 CCSM4 288×192 NCAR 美国 4 CMCC-CM 480×240 CMCC 意大利 5 CMCC-CMS 192×96 CMCC 意大利 6 CNRM-CM5 256×128 CNRM-CERFACS 法国 7 CSIRO-Mk3.6.0 192×96 CSIRO-QCCCE 澳大利亚 8 CanESM2 128×64 CCCMA 加拿大 9 HadGEM2-AO 192×144 NIMR/KMA 韩国/英国 10 HadGEM2-CC 192×144 MOHC 英国 11 HadGEM2-ES 192×96 MOHC 英国 12 IPSL-CM5A-LR 96×96 IPSL 法国 13 IPSL-CM5A-MR 144×143 IPSL 法国 14 IPSL-CM5B-LR 96×96 IPSL 法国 15 MIROC-ESM-CHEM 128×64 MIROC 日本 16 MIROC-ESM 128×64 MIROC 日本 17 MIROC5 256× 128 MIROC 日本 18 MPI-ESM-LR 192×96 MPI-M 德国 19 MPI-ESM-MR 192×96 MPI-M 德国 20 MRI-CGCM3 320× 160 MRI 日本 21 NorESMl-M 144×96 NCC 挪威 22 INMCM4 180×120 INM 俄罗斯  下载: 导出CSV
表 2 1961—2005年长江和黄河流域模拟和观测的年平均时间序列之间的相关系数
Table 2. Correlation coefficients between the annual average time series of the simulations and observations from 1961 to 2005 over the Yangtze and Yellow River basins
模式名称 TG TX TN ACCESS1.0 0.680 0.603 0.694 ACCESS1.3 0.479 0.336 0.466 CanESM2 0.659 0.490 0.746 CCSM4 0.484 0.363 0.574 CMCC-CM 0.390 0.181 0.531 CMCC-CMS 0.474 0.277 0.599 CNRM-CM5 0.175 0.014 0.367 CSIRO-Mk3.6.0 0.386 0.302 0.463 HadGEM2-AO 0.493 0.479 0.472 HadGEM2-CC 0.183 0.045 0.314 HadGEM2-ES 0.526 0.393 0.559 INM-CM4 0.186 0.156 0.227 IPSL-CM5A-LR 0.535 0.344 0.614 IPSL-CM5A-MR 0.371 0.164 0.543 IPSL-CM5B-LR 0.378 0.273 0.460 MIROC5 0.277 0.051 0.454 MIROC-ESM 0.247 0.115 0.291 MIROC-ESM-CHEM 0.322 0.167 0.471 MPI-ESM-LR 0.596 0.432 0.669 MPI-ESM-MR 0.539 0.396 0.630 MRI-CGCM3 0.224 0.074 0.350 NorESM1-M 0.326 0.134 0.422
下载: 导出CSV
表 3 16个ETCCDI极端气温指标的信息
Table 3. Information of 16 ETCCDI extreme temperature indices
分类 指标代码 指标名称 定义 单位 绝对指标 TXx(+) 日最高气温的最大值 日最高气温的最大值 ℃ TNx(+) 日最低气温的最大值 日最低气温的最大值 ℃ TXn(-) 日最高气温的最小值 日最高气温的最小值 ℃ TNn(-) 日最低气温的最小值 日最低气温的最小值 ℃ 百分位指标 TN10*(-) 冷夜温度 某段时间内日最低气温小于1961-1990年该时段内第10个百分位值的平均温度 ℃/day TX10*(-) 冷昼温度 某段时间内日最高气温小于1961-1990年该时段内第10个百分位值的平均温度 ℃/day TN90*(+) 暖夜温度 某段时间内日最低气温大于1961-1990年该时段内第90个百分位值的平均温度 ℃/day TX90*(+) 暖昼温度 某段时间内日最高气温大于1961-1990年该时段内第90个百分位值的平均温度 ℃/day 阈值指标 FD(-) 霜冻天数 日最低气温小于0 ℃的天数 days SU(+) 夏日天数 日最高气温大于25 ℃的天数 days ID(-) 冰冻天数 日最高气温小于0 ℃的天数 days TR(+) 夏夜天数 日最低气温大于20 ℃的天数 days 持续时间指标 WSDI(+) 暖期 日最高气温至少连续6天大于1961-1990年第90个百分位值的总天数 days CSDI(-) 冷期 日最低气温至少连续6天小于1961-1990年第10个百分位值的总天数 days GSL(+) 生长季长度 每年(北半球为1月1日-12月31日,南半球为7月1日-6月30日)日均温至少连续6天大于5 ℃第一次出现与同年7月1日(南半球为1月1日)以后日均温至少连续6天小于5 ℃第一次出现之间的时间间隔 days 范围指标 DTR 日较差 日最高气温与日最低气温的差值 ℃ 注:标有“*”的百分位指标的定义略有变化.带正号的指标是暖指标,带负号的指标是冷指标.
下载: 导出CSV
-
Aguilar, E., Aziz Barry, A., Brunet, M., et al., 2009.Changes in Temperature and Precipitation Extremes in Western Central Africa, Guinea Conakry, and Zimbabwe, 1955-2006.Journal of Geophysical Research Atmospheres, 114(D2):D02115. https://doi.org/10.1029/2008jd011010 Chapman, S.C., Watkins, N.W., Stainforth, D.A., 2019.Warming Trends in Summer Heatwaves.Geophysical Research Letters, 46(3):1634-1640. https://doi.org/10.1029/2018gl081004 Fan, L.J., Fu, C.B., Chen, D.L., 2005.Review on Creating Future Climate Change Scenarios by Statistical Downscaling Techniques.Advances in Earth Science, 20(3):320-329(in Chinese with English abstract). http://www.wanfangdata.com.cn/details/detail.do?_type=perio&id=dqkxjz200503009 Feng, R., Yu, R.D., Zheng, H.W., et al., 2018.Spatial and Temporal Variations in Extreme Temperature in Central Asia.International Journal of Climatology, 38:e388-e400. https://doi.org/10.1002/joc.5379 Fischer, E.M., Knutti, R., 2015.Anthropogenic Contribution to Global Occurrence of Heavy-Precipitation and High-Temperature Extremes.Nature Climate Change, 5(6):560-564. https://doi.org/10.1038/nclimate2617 Giorgi, F., Hurrell, J.W., Marinucci, M.R., et al., 1997.Elevation Dependency of the Surface Climate Change Signal:A Model Study.Journal of Climate, 10(2):288-296. http://femsle.oxfordjournals.org/lookup/external-ref?access_num=10.1175/1520-0442(1997)0102.0.CO;2&link_type=DOI Giorgi, F., Mearns, L.O., 1991.Approaches to the Simulation of Regional Climate Change:A Review.Reviews of Geophysics, 29(2):191-216. https://doi.org/10.1029/90rg02636 Guo, J.H., Huang, G.H., Wang, X.Q., et al., 2018.Dynamically-Downscaled Projections of Changes in Temperature Extremes over China.Climate Dynamics, 50:1045-1066. https://doi.org/10.1007/s00382-017-3660-7 Hanson, S., Nicholls, R., Ranger, N., et al., 2011.A Global Ranking of Port Cities with High Exposure to Climate Extremes.Climatic Change, 104(1):89-111. https://doi.org/10.1007/s10584-010-9977-4 Jones, B., O'Neill, B.C., McDaniel, L., et al., 2015.Future Population Exposure to US Heat Extremes.Nature Climate Change, 5:652-655. https://doi.org/10.1038/nclimate2631 King, A.D., Karoly, D.J., Henley, B.J., 2017.Australian Climate Extremes at 1.5 ℃ and 2 ℃ of Global Warming.Nature Climate Change, 7:412-416. https://doi.org/10.1038/nclimate3296 Li, S.S., Yang, S.N., 2015.Changes of Extreme Temperature Events in Beijing during 1960-2014.Scientia Geographica Sinica, 35(12):1640-1647(in Chinese with English abstract). http://www.wanfangdata.com.cn/details/detail.do?_type=perio&id=dlkx201512019 Liu, L.J., Li, C.A., Jie, D.M., et al., 2018.Paleoclimate Recorded by Phytolith in Anguli-Nuur Lake since Mid-Late Holocene.Earth Science, 43(11):4138-4148(in Chinese with English abstract). http://d.old.wanfangdata.com.cn/Periodical/dqkx201811029 Maxwell, S.L., Butt, N., Maron, M., et al., 2019.Conservation Implications of Ecological Responses to Extreme Weather and Climate Events.Diversity and Distributions, 25(4):613-625. https://doi.org/10.1111/ddi.12878 Panday, P.K., Thibeault, J., Frey, K.E., 2015.Changing Temperature and Precipitation Extremes in the Hindu Kush-Himalayan Region:An Analysis of CMIP3 and CMIP5 Simulations and Projections.International Journal of Climatology, 35(10):3058-3077. https://doi.org/10.1002/joc.4192 Pepin, N., Bradley, R.S., Diaz, H.F., et al., 2015.Elevation-Dependent Warming in Mountain Regions of the World.Nature Climate Change, 5:424-430. https://doi.org/10.1038/nclimate2563 Rangwala, I., Miller, J.R., Xu, M., 2009.Warming in the Tibetan Plateau:Possible Influences of the Changes in Surface Water Vapor.Geophysical Research Letters, 36(6). https://doi.org/10.1029/2009gl037245 Riahi, K., Rao, S., Krey, V., et al., 2011.RCP 8.5:A Scenario of Comparatively High Greenhouse Gas Emissions.Climatic Change, 109(1-2):33-57. https://doi.org/10.1007/s10584-011-0149-y Sillmann, J., Kharin, V.V., Zhang, X., et al., 2013a.Climate Extremes Indices in the CMIP5 Multimodel Ensemble:Part 1.Model Evaluation in the Present Climate.Journal of Geophysical Research:Atmospheres, 118(4):1716-1733. https://doi.org/10.1002/jgrd.50203 Sillmann, J., Kharin, V.V., Zwiers, F.W., et al., 2013b.Climate Extremes Indices in the CMIP5 Multimodel Ensemble:Part 2.Future Climate Projections.Journal of Geophysical Research:Atmospheres, 118(6):2473-2493. https://doi.org/10.1002/jgrd.50188 Sillmann, J., Roeckner, E., 2008.Indices for Extreme Events in Projections of Anthropogenic Climate Change.Climatic Change, 86(1-2):83-104. https://doi.org/10.1007/s10584-007-9308-6 Stocker, T., 2014.Climate Change 2013:The Physical Science Basis.Cambridge University Press, Cambridge. Stocker, T.F., Qin, D., Plattner, G.K., et al., 2013.IPCC, 2013:Climate Change 2013.Computational Geometry, 18:95-123. http://d.old.wanfangdata.com.cn/Periodical/qhbhyjjz201306007 Sun, Q.H., Miao, C.Y., Duan, Q.Y., 2015.Projected Changes in Temperature and Precipitation in Ten River Basins over China in 21st Century.International Journal of Climatology, 35(6):1125-1141. https://doi.org/10.1002/joc.4043 Sun, Q.H., Miao, C.Y., Duan, Q.Y., 2016.Extreme Climate Events and Agricultural Climate Indices in China:CMIP5 Model Evaluation and Projections.International Journal of Climatology, 36(1):43-61. https://doi.org/10.1002/joc.4328 Taylor, K.E., 2001.Summarizing Multiple Aspects of Model Performance in a Single Diagram.Journal of Geophysical Research:Atmospheres, 106(D7):7183-7192. https://doi.org/10.1029/2000jd900719 Taylor, K.E., Stouffer, R.J., Meehl, G.A., 2012.An Overview of CMIP5 and the Experiment Design.Bulletin of the American Meteorological Society, 93(4):485-498. http://www.wanfangdata.com.cn/details/detail.do?_type=perio&id=e25af06b6d0b93bec8e211bdc3bbfed0 Thomson, A.M., Calvin, K.V., Smith, S.J., et al., 2011.RCP4.5:A Pathway for Stabilization of Radiative Forcing by 2100.Climatic Change, 109(1-2):77-94. https://doi.org/10.1007/s10584-011-0151-4 Wang, Q.X., Fan, X.H., Wang, M.B., 2016.Evidence of High-Elevation Amplification versus Arctic Amplification.Scientific Reports, 6:19219. https://doi.org/10.1038/srep19219 Wilby, R.L., Wigley, T.M.L., 1997.Downscaling General Circulation Model Output:A Review of Methods and Limitations.Progress in Physical Geography:Earth and Environment, 21(4):530-548. https://doi.org/10.1177/030913339702100403 Xiang, F.F., Wang, L.C., Yao, R., et al., 2018.The Characteristics of Climate Change and Response of Vegetation in Three Gorges Reservoir Area.Earth Science, 43(Suppl.1):42-52(in Chinese with English abstract). http://www.wanfangdata.com.cn/details/detail.do?_type=perio&id=dqkx2018z1005 Xu, K., Wu, C.H., Hu, B.X., 2019a.Projected Changes of Temperature Extremes over Nine Major Basins in China Based on the CMIP5 Multimodel Ensembles.Stochastic Environmental Research and Risk Assessment, 33(1):321-339. https://doi.org/10.1007/s00477-018-1569-2 Xu, K., Xu, B.B., Ju, J.L., et al., 2019b.Projection and Uncertainty of Precipitation Extremes in the CMIP5 Multimodel Ensembles over Nine Major Basins in China.Atmospheric Research, 226:122-137. https://doi.org/10.1016/j.atmosres.2019.04.018 Xu, Y., Gao, X.J., Giorgi, F., et al., 2018.Projected Changes in Temperature and Precipitation Extremes over China as Measured by 50 yr Return Values and Periods Based on a CMIP5 Ensemble.Advances in Atmospheric Sciences, 35(4):376-388. https://doi.org/10.1007/s00376-017-6269-1 You, Q.L., Min, J.Z., Fraedrich, K., et al., 2014.Projected Trends in Mean, Maximum, and Minimum Surface Temperature in China from Simulations.Global and Planetary Change, 112:53-63. https://doi.org/10.1016/j.gloplacha.2013.11.006 Yue, T.X., Zhao, N., Fan, Z.M., et al., 2016.CMIP5 Downscaling and Its Uncertainty in China.Global and Planetary Change, 146:30-37. https://doi.org/10.1016/j.gloplacha.2016.09.003 Zhang, D.R., Zheng, J., Fan, J.L., et al., 2019.Spatiotemporal Variations of Extreme Temperature Indices in Different Climatic Zones of China over the Past 60 Years.Chinese Journal of Agrometeorology, 40(7):422-434(in Chinese with English abstract). http://d.old.wanfangdata.com.cn/Periodical/zgnyqx201907002 Zhao, F.F., Xu, Z.X., 2007.Comparative Analysis on Downscaled Climate Scenarios for Headwater Catchment of Yellow River Using SDS and Delta Methods.Acta Meteorologica Sinica, 65(4):653-662(in Chinese with English abstract). http://www.wanfangdata.com.cn/details/detail.do?_type=perio&id=qxxb200704017 Zhou, B.T., Wen, Q.H., Xu, Y., et al., 2014.Projected Changes in Temperature and Precipitation Extremes in China by the CMIP5 Multimodel Ensembles.Journal of Climate, 27(17):6591-6611. http://www.wanfangdata.com.cn/details/detail.do?_type=perio&id=1fb87ebac6e075b35d5aa4178eb9fc0f Zhou, T.J., Yu, R.C., 2006.Twentieth-Century Surface Air Temperature over China and the Globe Simulated by Coupled Climate Models.Journal of Climate, 19(22):5843-5858. https://doi.org/10.1175/jcli3952.1 范丽军, 符淙斌, 陈德亮, 2005.统计降尺度法对未来区域气候变化情景预估的研究进展.地球科学进展, 20(3):320-329. http://d.old.wanfangdata.com.cn/Periodical/dqkxjz200503009 李双双, 杨赛霓, 2015.1960-2014年北京极端气温事件变化特征.地理科学, 35(12):1640-1647. 刘林敬, 李长安, 介冬梅, 等, 2018.中-晚全新世以来安固里淖气候演变的植硅体记录.地球科学, 43(11):4138-4148. doi: 10.3799/dqkx.2018.614 向菲菲, 王伦澈, 姚瑞, 等, 2018.三峡库区气候变化特征及其植被响应.地球科学, 43(增刊1):42-52. doi: 10.3799/dqkx.2018.912 张大任, 郑静, 范军亮, 等, 2019.近60年中国不同气候区极端温度事件的时空变化特征.中国农业气象, 40(7):422-434. http://d.old.wanfangdata.com.cn/Periodical/zgnyqx201907002 赵芳芳, 徐宗学, 2007.统计降尺度方法和Delta方法建立黄河源区气候情景的比较分析.气象学报, 65(4):653-662. http://d.old.wanfangdata.com.cn/Periodical/qxxb200704017 -

 点击查看大图
计量
- 文章访问数: 1989
- HTML全文浏览量: 553
- PDF下载量: 76
- 被引次数: 0
