


Uncertainties of Landslide Susceptibility Prediction: Different Attribute Interval Divisions of Environmental Factors and Different Data-Based Models
-
摘要: 对于滑坡易发性预测建模,连续型环境因子在频率比分析时的属性区间划分数量(attribute interval numbers,AIN)和不同易发性预测模型是两个重要不确定性因素.为研究这两个因素对建模的影响规律,以江西省上犹县为例,考虑5种连续型环境因子AIN划分(4、8、12、16及20)和5种数据驱动模型(层次分析法(analytic hierarchy process,AHP)、逻辑回归(logistic regression,LR)、BP神经网络(back-propagation neural network,BPNN)、支持向量机(support vector machine,SVM)和随机森林(random forest,RF)),总计25种不同工况下的滑坡易发性预测研究.再开展滑坡易发性指数的不确定性(包括精度评价和统计规律等)分析.结果表明:(1)对于同一模型,随着AIN值从4增加至8再到20时,易发性预测精度先逐渐提升,然后缓慢提升直至稳定;(2)对于同一AIN值,RF模型预测精度最高,其后依次为SVM、BPNN、LR和AHP模型;(3)在25种组合工况下,AIN=20和RF模型的预测精度最高,AIN=4和AHP模型精度最低,但在AIN=8和RF模型组合下的易发性建模效率较高且精度也较高;(4)更大的AIN值和更先进的机器学习模型预测出的滑坡易发性指数的不确定性相对较低,更符合实际的滑坡概率分布特征.在环境因子属性区间划分为8和RF模型工况下高效准确地构建滑坡易发性预测模型.Abstract: The attribute interval numbers (AIN) in the frequency ratio analysis of continuous environmental factors and the landslide susceptibility model are two important uncertainties affecting the results of landslide susceptibility prediction (LSP). To study the effects of the two uncertain factors on the change rules of LSP, taking Shangyou County of Jiangxi Province, China, as study area, the AIN values of the continuous environmental factors are respectively set to be 4, 8, 12, 16 and 20. Meanwhile, five different data-based models (analytic hierarchy process (AHP), logistic regression (LR), BP neural network (BPNN), support vector machines (SVM) and random forests (RF)) are selected as LSP models. Hence, there are a total of 25 types of different calculation conditions for LSP. Finally, the accuracy and uncertainties of LSP are analyzed. The results show that: (1) For a certain model, the LSP accuracy gradually increases with the AIN value increasing from 4 to 8, then slowly increases to a stable level with AIN increasing from 8 to 20; (2) For a certain AIN, the LSP accuracy of the RF model is higher than SVM, followed by the BPNN, LR and AHP models; (3) Under all the 25 calculation conditions, the prediction accuracy of AIN=20 and RF model is the highest while that of AIN=4 and AHP model is the lowest, and the modeling efficiency and accuracy of AIN=8 and RF model are very high; (4) The landslide susceptibility indexes calculated by the higher AIN and more advanced machine learning models are more consistent with the actual distribution features of landslide probability and have relatively lower uncertainties. It can be concluded that an efficient and relatively accurate LSP model can be built under the condition of AIN value of 8 and RF model.
-

图 1 上犹县地理位置图(a)和滑坡编录图(b)
Fig. 1. Location of the study area (a) and landslide inventory map (b)
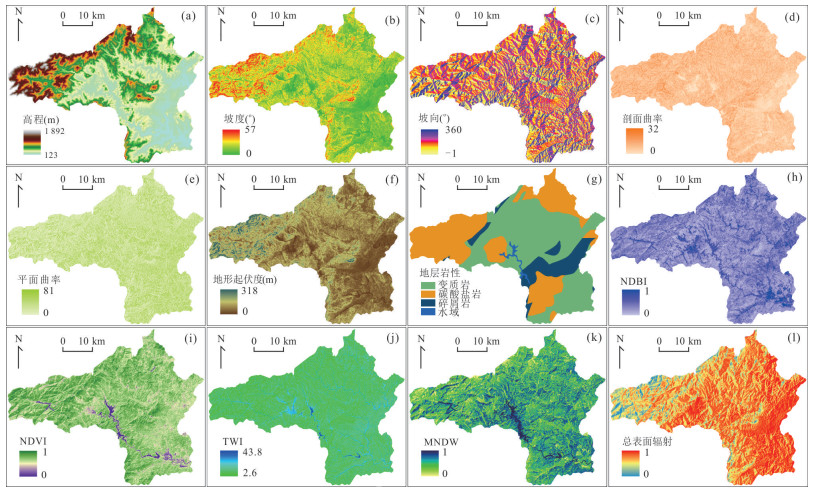
图 2 地形地貌、地表覆被、水文环境以及地质因子
Fig. 2. The topographical factors, land cover, hydrology and geological factors

图 3 AIN为8和5类模型预测滑坡易发性
Fig. 3. Landslide susceptibility maps of AIN of 8 and 5 different models
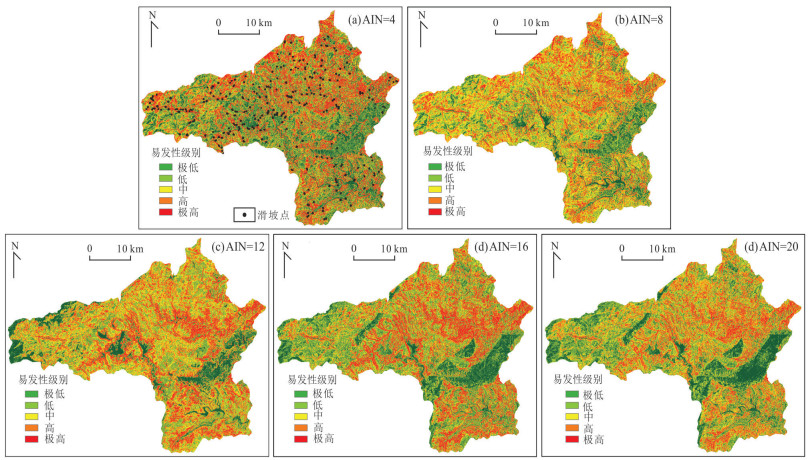
图 4 各种AIN值以及BPNN模型预测滑坡易发性
Fig. 4. Landslide susceptibility maps of different AINs and BPNN models
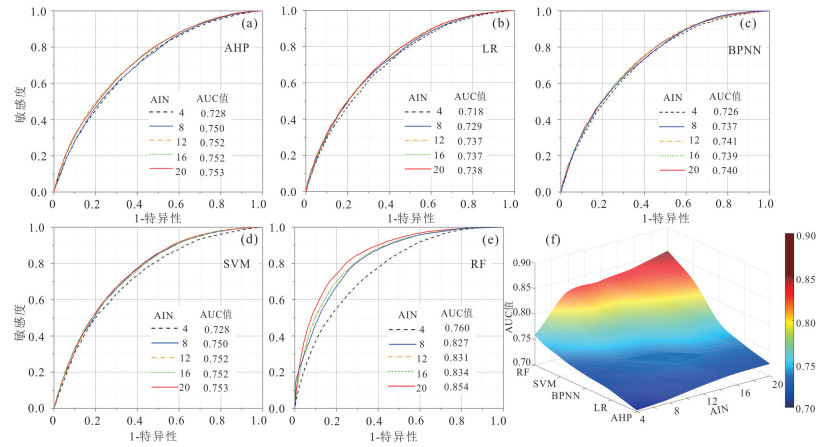
图 5 各模型及不同AIN的ROC曲线
a.AHP; b.LR; c.BPNN; d.SVM; e.RF; f.AUC值三维趋势图
Fig. 5. ROC curves of each models and different AINs
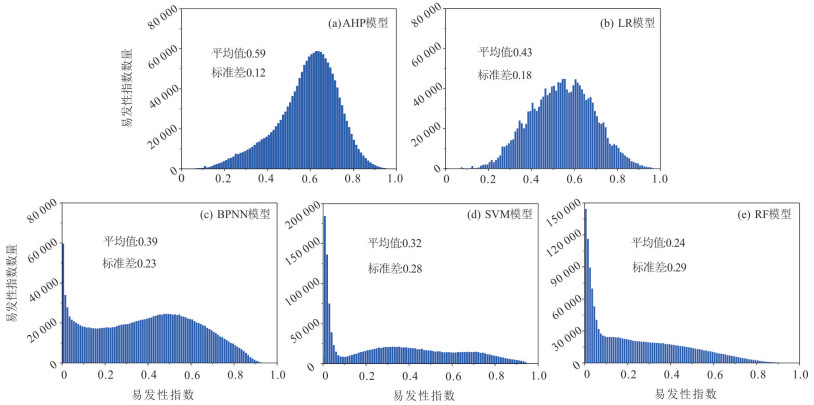
图 6 AIN为8时各模型易发性指数分布特征
Fig. 6. Landslide susceptibility indexes distributions of different models under AIN of 8

图 7 BPNN预测各AIN时的易发性指数分布
Fig. 7. Landslide susceptibility indexes distributions of each AIN by BPNN model
表 1 地形地貌因子FR值
Table 1. Frequency ratio of topographical factors
环境因子 AIN=4 AIN=8 AIN=12 AIN=16 AIN=20 属性区间 FR值 属性区间 FR值 属性区间 FR值 属性区间 FR值 属性区间 FR值 高程(m) 122~345 1.292 122~261 1.241 122~240 1.178 122~227 1.046 122~213 0.937 345~594 0.859 261~386 1.191 240~338 1.432 227~317 1.567 213~289 1.629 594~955 0.682 386~525 0.878 338~ 442 0.781 317~407 0.923 289~365 1.149 955~1 892 0.413 525~678 0.764 442~546 0.995 407~504 0.814 365~449 0.721 678~851 0.727 546~657 0.702 504~601 1.013 449~532 1.041 851~1 052 0.682 657~768 0.896 601~699 0.648 532~615 0.839 1 052~1 295 0.491 768~886 0.462 699~796 0.819 615~699 0.652 1 295~1 892 0.000 8 861~1 011 0.776 796~893 0.470 699~782 0.859 1 011~1 143 0.726 893~990 0.778 782~865 0.413 1 143~1 288 0.062 990~1 087 0.515 865~948 0.790 1 288~1 448 0.000 1 087~1 191 0.821 948~10 25 0.693 1 448~1 892 0.000 1 191~1 295 0.000 1 025~1 101 0.543 1 295~1 399 0.000 1 101~1 184 0.779 1 504~1 635 0.000 1 261~1 337 0.000 1 635~1 892 0.000 1 337~1 413 0.000 1 413~1 490 0.000 1 490~1 566 0.000 1 566~1 691 0.000 1 691~1 892 0.000 坡度(°) 0~8 0.525 0~5 0.218 0~4 0.183 0~3 0.142 0~2 0.105 8~16 1.417 5~9 0.973 4~8 0.759 3~6 0.566 2~5 0.356 16~25 1.159 9~14 1.453 8~11 1.321 6~10 1.120 5~8 0.880 25~57 0.573 14~18 1.373 11~15 1.508 10~12 1.475 8~10 1.254 18~22 1.163 15~18 1.328 12~15 1.451 10~13 1.527 22~28 0.880 18~21 1.204 15~18 1.272 13~16 1.452 28~35 0.602 21~24 1.010 18~21 1.220 16~19 1.264 35~57 0.228 24~27 0.821 21~24 1.021 19~21 1.199 27~31 0.682 24~26 0.868 21~23 1.055 31~36 0.403 26~29 0.756 23~25 0.900 36~41 0.309 29~32 0.609 25~28 0.722 41~57 0.000 32~34 0.383 28~30 0.799 34~37 0.331 30~32 0.464 37~41 0.265 32~34 0.416 41~45 0.000 34~37 0.317 45~57 0.000 37~39 0.371 39~42 0.041 42~45 0.000 45~48 0.000 48~57 0.000 注:以高程和坡度为例.  下载: 导出CSV
表 2 水文环境因子FR值
Table 2. Frequency ratio of hydrologic factors
环境因子 AIN=4 AIN=8 AIN=12 AIN=16 AIN=20 属性区间 FR值 属性区间 FR值 属性区间 FR值 属性区间 FR值 属性区间 FR值 TWI 2~6 1.021 2~5 1.028 2~4 1.034 2~4 1.003 2~4 0.937 6~9 1.068 5~6 1.069 4~6 1.012 4~5 1.042 4~5 1.069 9~23 0.485 6~9 1.010 6~7 1.150 5~6 1.075 5~6 1.039 23~43 0.000 9~13 0.521 7~9 0.962 6~7 1.132 6~7 1.186 13~24 0.508 9~11 0.608 7~9 0.872 7~8 0.990 24~33 0.000 11~13 0.472 9~11 0.552 8~10 0.706 33~37 0.000 13~16 0.552 11~12 0.466 10~11 0.428 37~43 0.000 16~25 0.406 12~14 0.620 11~13 0.527 25~33 0.000 14~16 0.361 13~14 0.655 33~35 0.000 16~18 0.662 14~16 0.374 35~39 0.000 18~25 0.000 16~17 0.517 39~43 0.000 25~32 0.000 17~18 0.452 32~33 0.000 18~20 0.000 33~35 0.000 20~25 0.000 35~39 0.000 25~32 0.000 39~43 0.000 32~33 0.000 33~35 0.000 35~37 0.000 37~40 0.000 40~43 0.000 注:以TWI为例.
下载: 导出CSV
表 3 地表覆被与地质环境因子FR值
Table 3. FR of land cover and geological factors
环境因子 AIN=4 AIN=8 AIN=12 AIN=16 AIN=20 属性区间 FR值 属性区间 FR值 属性区间 FR值 属性区间 FR值 属性区间 FR值 NDVI 0.01~0.16 0.514 0.01~0.09 0.420 0.01~0.06 0.390 0.01~0.04 0.320 0.01~0.02 0.126 0.16~0.27 1.325 0.09~0.18 0.885 0.06~0.12 0.469 0.04~0.08 0.629 0.02~0.05 0.534 0.27~0.34 0.989 0.18~0.24 1.447 0.12~0.18 1.011 0.08~0.13 0.443 0.05~0.08 0.594 0.34~0.50 0.848 0.24~0.28 1.260 0.18~0.21 1.345 0.13~0.16 0.811 0.08~0.11 0.463 0.28~0.31 0.977 0.21~0.25 1.451 0.16~0.20 1.339 0.11~0.14 0.644 0.31~0.35 0.971 0.25~0.27 1.256 0.20~0.23 1.377 0.14~0.17 0.964 0.35~0.38 0.801 0.27~0.30 1.015 0.23~0.25 1.449 0.17~0.19 1.333 0.38~0.50 0.911 0.30~0.32 0.952 0.25~0.27 1.245 0.19~0.22 1.378 0.32~0.35 0.979 0.27~0.29 1.057 0.22~0.24 1.478 0.35~0.37 0.802 0.29~0.31 0.959 0.24~0.26 1.329 0.37~0.40 0.872 0.31~0.33 0.977 0.26~0.28 1.171 0.40~0.50 0.857 0.33~0.35 0.920 0.28~0.30 0.975 0.35~0.37 0.783 0.30~0.32 0.937 0.37~0.39 0.844 0.32~0.34 1.006 0.39~0.42 0.894 0.34~0.36 0.819 0.42~0.50 0.938 0.36~0.38 0.753 0.38~0.40 0.919 0.40~0.41 0.895 0.41~0.43 0.913 0.43~0.50 0.896 地层岩性 变质岩 1.161 碳酸盐岩 1.018 碎屑岩 0.301 水域 0.000 注:以NDVI和地层岩性为例.
下载: 导出CSV
表 4 各工况下LR系数和常数项
Table 4. Logistic regression coefficients and constant terms
环境因子 AIN=4 AIN=8 AIN=12 AIN=16 AIN=20 高程 1.507 3.920 1.386 1.149 1.036 坡度 0.842 0.668 0.974 0.814 0.848 坡向 -0.567 1.161 0.972 1.069 1.107 剖面曲率 0.962 -0.254 0.380 0.537 0.464 平面曲率 1.117 1.021 1.164 1.109 1.098 地形起伏度 0.300 -0.070 0.350 0.474 1.350 地层岩性 1.467 0.967 1.211 1.333 0.419 NDBI 0.994 1.342 1.103 1.167 1.137 NDVI 0.264 0.250 0.354 0.255 0.290 TWI 0.881 0.400 0.496 0.457 0.436 MNDWI 1.304 1.584 1.117 1.120 1.091 地表总辐射 0.761 0.447 0.608 0.548 0.453 常数 -10.173 -11.388 -10.533 -10.449 -10.154
下载: 导出CSV
表 5 不同数据驱动模型和不同AIN组合工况下的AUC精度值
Table 5. AUC values of different data-based models and different AIN values
模型 AIN 4 8 12 16 20 AHP 0.701 0.708 0.717 0.723 0.724 LR 0.718 0.729 0.737 0.737 0.738 BPNN 0.726 0.737 0.741 0.739 0.740 SVM 0.728 0.750 0.752 0.752 0.753 RF 0.760 0.827 0.831 0.834 0.854
下载: 导出CSV
表 6 不同AIN和不同模型的Friedman按秩的双向方差分析
Table 6. Friedman two-way ANOVA tests by rank for different AIN values and different models
建模工况 AIN对比 显著性 AIN对比 显著性 AIN对比 显著性 AIN对比 显著性 不同AIN和BPNN模型 4, 80 1.000 4, 12 0.027 8, 12 0.455 4, 16 0.027 8, 16 1.000 12, 16 1.000 4, 20 0.003 8, 20 0.124 12, 20 1.000 16, 20 1.000 建模工况 模型对比 显著性 模型对比 显著性 模型对比 显著性 模型对比 显著性 AIN=8和不同模型 AHP, LR 1.000 AHP, BPNN 0.455 LR, BPNN 1.000 AHP, SVM 0.027 LR, SVM 0.455 BPNN, SVM 1.000 AHP, RF 0.001 LR, RF 0.027 BPNN, RF 0.455 SVM, RF 1.000
下载: 导出CSV
-
Aghdam, I.N., Pradhan, B., Panahi, M., 2017.Landslide Susceptibility Assessment Using a Novel Hybrid Model of Statistical Bivariate Methods (FR and WOE) and Adaptive Neuro-Fuzzy Inference System (ANFIS) at Southern Zagros Mountains in Iran.Environmental Earth Sciences, 76(6):1-22. https://doi.org/10.1007/s12665-017-6558-0 Bueechi, E., Klimeš, J., Frey, H., et al., 2019.Regional-Scale Landslide Susceptibility Modelling in the Cordillera Blanca, Peru:A Comparison of Different Approaches.Landslides, 16(2):395-407. https://doi.org/10.1007/s10346-018-1090-1 Chakraborty, A., Goswami, D., 2017.Prediction of Slope Stability Using Multiple Linear Regression (MLR) and Artificial Neural Network (ANN).Arabian Journal of Geosciences, 10(17):385. https://doi.org/10.1007/s12517-017-3167-x Chang, Z.L., Du, Z., Zhang, F., et al., 2020.Landslide Susceptibility Prediction Based on Remote Sensing Images and GIS:Comparisons of Supervised and Unsupervised Machine Learning Models.Remote Sensing, 12(3):502. https://doi.org/10.3390/rs12030502 Chen, W., Peng, J.B., Hong, H.Y., et al., 2018.Landslide Susceptibility Modelling Using GIS-Based Machine Learning Techniques for Chongren County, Jiangxi Province, China.Science of the Total Environment, 626:1121-1135. https://doi.org/10.1016/j.scitotenv.2018.01.124 Chen, W., Xie, X.S., Wang, J.L., et al., 2017.A Comparative Study of Logistic Model Tree, Random Forest, and Classification and Regression Tree Models for Spatial Prediction of Landslide Susceptibility.Catena, 151:147-160. https://doi.org/10.1016/j.catena.2016.11.032 Dou, J., Yunus, A.P., Tien Bui, D., et al., 2019.Assessment of Advanced Random Forest and Decision Tree Algorithms for Modeling Rainfall-Induced Landslide Susceptibility in the Izu-Oshima Volcanic Island, Japan.Science of the Total Environment, 662:332-346. https://doi.org/10.1016/j.scitotenv.2019.01.221 Fanos, A.M., Pradhan, B., Mansor, S., et al., 2018.A Hybrid Model Using Machine Learning Methods and GIS for Potential Rockfall Source Identification from Airborne Laser Scanning Data.Landslides, 15(9):1833-1850. https://doi.org/10.1007/s10346-018-0990-4 Feng, H.J., Zhou, A.G., Yu, J.J., et al., 2016.A Comparative Study on Plum-Rain-Triggered Landslide Susceptibility Assessment Models in West Zhejiang Province.Earth Science, 41(3):403-415(in Chinese with English abstract). Guo, Z.Z., Yin, K.L., Fu, S., et al., 2019.Evaluation of Landslide Susceptibility Based on GIS and WOE-BP Model.Earth Science, 44(12):4299-4312(in Chinese with English abstract). http://www.researchgate.net/publication/324390254_Evaluation_of_Landslide_Susceptibility_Based_on_GIS_and_WOE-BP_Model Guo, Z.Z., Yin, K.L., Huang, F.M., et al., 2019.Evaluation of Landslide Susceptibility Based on Landslide Classification and Weighted Frequency Ratio Model.Chinese Journal of Rock Mechanics and Engineering, 38(2):287-300(in Chinese with English abstract). Hong, H.Y., Pourghasemi, H.R., Pourtaghi, Z.S., 2016.Landslide Susceptibility Assessment in Lianhua County (China):A Comparison between a Random Forest Data Mining Technique and Bivariate and Multivariate Statistical Models.Geomorphology, 259:105-118. https://doi.org/10.1016/j.geomorph.2016.02.012 Huang, F.M., Wang, Y., Dong, Z.L., et al., 2019.Regional Landslide Susceptibility Mapping Based on Grey Relational Degree Model.Earth Science, 44(2):664-676 (in Chinese with English abstract). Huang, F.M., Yin, K.L., Jiang, S.H., et al., 2018.Landslide Susceptibility Assessment Based on Clustering Analysis and Support Vector Machine.Chinese Journal of Rock Mechanics and Engineering, 37(1):156-167(in Chinese with English abstract). Huang, F.M., Zhang, J., Zhou, C.B., et al., 2020.A Deep Learning Algorithm Using a Fully Connected Sparse Autoencoder Neural Network for Landslide Susceptibility Prediction.Landslides, 17(1):217-229. https://doi.org/10.1007/s10346-019-01274-9 Li, L.P., Lan, H.X., Guo, C.B., et al., 2017.A Modified Frequency Ratio Method for Landslide Susceptibility Assessment.Landslides, 14(2):727-741. https://doi.org/10.1007/s10346-016-0771-x Lin, S., Wang, W., Deng, X.H., et al., 2019.Geophysical Observation of Typical Landslides in Three Gorges Reservoir Area and Its Significance:A Case Study of Sifangbei Landslide in Wanzhou District.Earth Science, 44(9):3135-3146(in Chinese with English abstract). http://en.cnki.com.cn/Article_en/CJFDTotal-DQKX201909026.htm Liu, Y., Zhao, B.B., Yin, K.L., et al., 2019.Sensitivity Analysis of Maliulin Landslide Stability Based on Orthogonal Design.Earth Science, 44(2):677-684(in Chinese with English abstract). Luo, Y., He, S.M., He, J.C., 2014.Effect of Rainfall Patterns on Stability of Shallow Landslide.Earth Science, 39(9):1357-1363(in Chinese with English abstract). Park, H.J., Jang, J.Y., Lee, J.H., 2019.Assessment of Rainfall-Induced Landslide Susceptibility at the Regional Scale Using a Physically Based Model and Fuzzy-Based Monte Carlo Simulation.Landslides, 16(4):695-713. https://doi.org/10.1007/s10346-018-01125-z Park, S., Choi, C., Kim, B., et al., 2013.Landslide Susceptibility Mapping Using Frequency Ratio, Analytic Hierarchy Process, Logistic Regression, and Artificial Neural Network Methods at the Inje Area, Korea.Environmental Earth Sciences, 68(5):1443-1464. https://doi.org/10.1007/s12665-012-1842-5 Pereira, D.G., Afonso, A., Medeiros, F.M., 2015.Overview of Friedman's Test and Post-Hoc Analysis.Communications in Statistics-Simulation and Computation, 44(10):2636-2653. https://doi.org/10.1080/03610918.2014.931971. Reichenbach, P., Rossi, M., Malamud, B.D., et al., 2018.A Review of Statistically-Based Landslide Susceptibility Models.Earth-Science Reviews, 180:60-91. https://doi.org/10.1016/j.earscirev.2018.03.001 Tien Bui, D., Tuan, T.A., Klempe, H., et al., 2016.Spatial Prediction Models for Shallow Landslide Hazards:A Comparative Assessment of the Efficacy of Support Vector Machines, Artificial Neural Networks, Kernel Logistic Regression, and Logistic Model Tree.Landslides, 13(2):361-378. https://doi.org/10.1007/s10346-015-0557-6 Wu, Y.P., Zhang, Q.X., Tang, H.M., et al., 2014.Landslide Hazard Warning Based on Effective Rainfall Intensity.Earth Science, 39(7):889-895(in Chinese with English abstract). Xu, C., Dai, F.C., Xu, X.W., 2011.Earthquake Triggered Landslide Susceptibility Evaluation Based on GIS Platform and Weight-of-Evidence Modeling.Earth Science, 36(6):1155-1164(in Chinese with English abstract). http://en.cnki.com.cn/Article_en/CJFDTotal-DQKX201106022.htm Youssef, A.M., Pourghasemi, H.R., Pourtaghi, Z.S., et al., 2016.Landslide Susceptibility Mapping Using Random Forest, Boosted Regression Tree, Classification and Regression Tree, and General Linear Models and Comparison of Their Performance at Wadi Tayyah Basin, Asir Region, Saudi Arabia.Landslides, 13(5):839-856. https://doi.org/10.1007/s10346-015-0614-1 Zhang, J., Yin, K.L., Wang, J.J., et al., 2016.Evaluation of Landslide Susceptibility for Wanzhou District of Three Gorges Reservoir.Chinese Journal of Rock Mechanics and Engineering, 35(2):284-296(in Chinese with English abstract). Zhang, S.H., Wu, G., 2019.Debris Flow Susceptibility and Its Reliability Based on Random Forest and GIS.Earth Science, 44(9):3115-3134(in Chinese with English abstract). http://en.cnki.com.cn/Article_en/CJFDTotal-DQKX201909025.htm Zhang, T.L., Zhou, A.G., Sun, Q., et al., 2017.Characteristics of the Groundwater Seepage and Failure Mechanisms of Landslide Induced by Typhoon Rainstorm.Earth Science, 42(12):2354-2362(in Chinese with English abstract). http://en.cnki.com.cn/Article_en/CJFDTOTAL-DQKX201712019.htm Zhao, J.B., Liu, Y.X., Liu, N., et al., 2019.Spatial Prediction Method of Regional Landslide Based on Distributed BP Neural Network Algorithm under Massive Monitoring Data.Rock and Soil Mechanics, 40(7):2866-2872(in Chinese with English abstract). 冯杭建, 周爱国, 俞剑君, 等, 2016.浙西梅雨滑坡易发性评价模型对比.地球科学, 41(3):403-415. doi: 10.3799/dqkx.2016.032 郭子正, 殷坤龙, 付圣, 等, 2019a.基于GIS与WOE-BP模型的滑坡易发性评价.地球科学, 44(12):4299-4312. doi: 10.3799/dqkx.2018.555 郭子正, 殷坤龙, 黄发明, 等, 2019b.基于滑坡分类和加权频率比模型的滑坡易发性评价.岩石力学与工程学报, 38(2):287-300. https://www.cnki.com.cn/Article/CJFDTOTAL-YSLX201902007.htm 黄发明, 汪洋, 董志良, 等, 2019.基于灰色关联度模型的区域滑坡敏感性评价.地球科学, 44(2):664-676. doi: 10.3799/dqkx.2018.175 黄发明, 殷坤龙, 蒋水华, 等, 2018.基于聚类分析和支持向量机的滑坡易发性评价.岩石力学与工程学报, 37(1):156-167. https://www.cnki.com.cn/Article/CJFDTOTAL-YSLX201801016.htm 林松, 王薇, 邓小虎, 等, 2019.三峡库区典型滑坡地球物理实测及其意义:以万州区四方碑滑坡为例.地球科学, 44(9):3135-3146. doi: 10.3799/dqkx.2019.074 刘毅, 赵斌滨, 殷坤龙, 等, 2019.基于正交设计的麻柳林滑坡稳定性敏感分析.地球科学, 44(2):677-684. doi: 10.3799/dqkx.2018.195 罗渝, 何思明, 何尽川, 2014.降雨类型对浅层滑坡稳定性的影响.地球科学, 39(9):1357-1363. doi: 10.3799/dqkx.2014.118 吴益平, 张秋霞, 唐辉明, 等, 2014.基于有效降雨强度的滑坡灾害危险性预警.地球科学, 39(7):889-895. doi: 10.3799/dqkx.2014.083 许冲, 戴福初, 徐锡伟, 2011.基于GIS平台与证据权的地震滑坡易发性评价.地球科学, 36(6):1155-1164. http://www.earth-science.net/article/id/2192 张俊, 殷坤龙, 王佳佳, 等, 2016.三峡库区万州区滑坡灾害易发性评价研究.岩石力学与工程学报, 35(2):284-296. https://www.cnki.com.cn/Article/CJFDTOTAL-YSLX201404018.htm 张书豪, 吴光, 2019.随机森林与GIS的泥石流易发性及可靠性.地球科学, 44(9):3115-3134. doi: 10.3799/dqkx.2019.081 张泰丽, 周爱国, 孙强, 等, 2017.台风暴雨条件下滑坡地下水渗流特征及成因机制.地球科学, 42(12):2354-2362. doi: 10.3799/dqkx.2017.570 赵久彬, 刘元雪, 刘娜, 等, 2019.海量监测数据下分布式BP神经网络区域滑坡空间预测方法.岩土力学, 40(7):2866-2872. https://www.cnki.com.cn/Article/CJFDTOTAL-YTLX201907042.htm -

 点击查看大图
计量
- 文章访问数: 2156
- HTML全文浏览量: 877
- PDF下载量: 121
- 被引次数: 0
