


Concentration Variation Characteristics of Atmospheric Greenhouse Gases at Waliguan and Shangdianzi in China
-
摘要: 研究典型区域大气温室气体的变化有助于有效应对气候变化、减缓全球变暖和减少极端气候事件.选取1997-2018年瓦里关和2009-2015年上甸子温室气体月值数据,应用线性趋势分析法和Mann-Kendall突变检验法分析两站温室气体的时间序列特征、季节变化趋势,构建HYSPLIT后向轨迹模型分析季风运输和大气边界层条件对温室气体的潜在影响.瓦里关和上甸子温室气体均逐年增长,具有明显的季节变化特征.两站CO2均在8月达到最低值,CH4则在8月达到峰值,SF6四季差异不大.瓦里关N2O在12月达到最高,6月降到最低;而上甸子N2O在7月达到峰值,9月降至最低.瓦里关和上甸子大气温室气体均受到局地生物源和非生物源、季风远距离运输、大气边界层条件和光化学过程等多种因素的共同作用.Abstract: Studying the changes of atmospheric greenhouse gases in typical regions will help effectively cope with climate change, slow global warming and reduce extreme climate events. In this paper, monthly data and the linear trend analysis method and Mann-Kendall mutation test method were used to analyze the characteristics of time series and seasonal variations of atmospheric greenhouse gases at Waliguan station during 1997-2018 and Shangdianzi station during 2009-2015. The HYSPLIT backward trajectory model was established to analyze the potential impacts of monsoon transportation and atmospheric boundary layer conditions on greenhouse gases. The greenhouse gases at both Waliguan and Shangdianzi stations significantly increased year by year, with obvious seasonal variations. Atmospheric CO2 at the two stations fell to the lowest in August, atmospheric CH4 reached peaks in August, and SF6 reached its maximum values in August and September, respectively. Atmospheric N2O at Waliguan station reached the highest in December and fell to the lowest in June, while atmospheric N2O at Shangdianzi station reached peaks in July and fell to its lowest in September. Atmospheric greenhouse gases at both Waliguan and Shangdianzi were affected by various factors such as local biological and non-biological sources, long-distance monsoon transportation, atmospheric boundary layer conditions and photochemical processes.
-
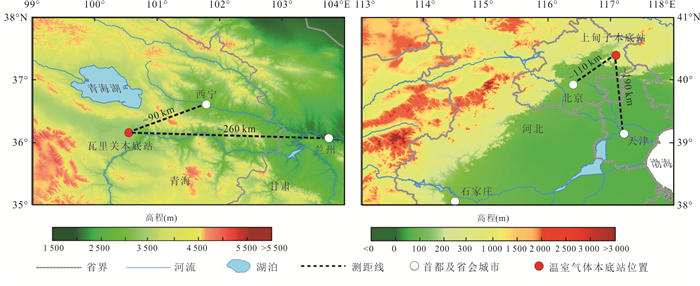
图 1 中国瓦里关和上甸子本底站的地理位置
Fig. 1. Geographical location of Waliguan and Shangdianzi background stations in China
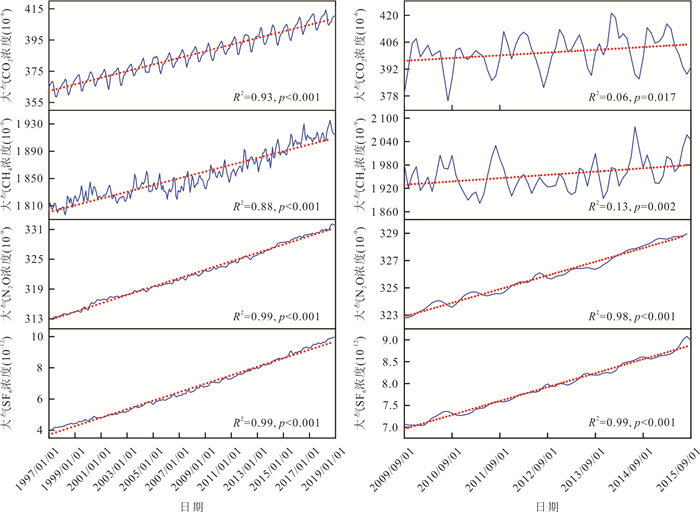
图 2 1997-2018年瓦里关本底站和2009-2015年上甸子本底站大气温室气体的时间序列
Fig. 2. The time series of atmospheric greenhouse gases for 1997-2018 at Waliguan background station and 2009-2015 at Shangdianzi background station
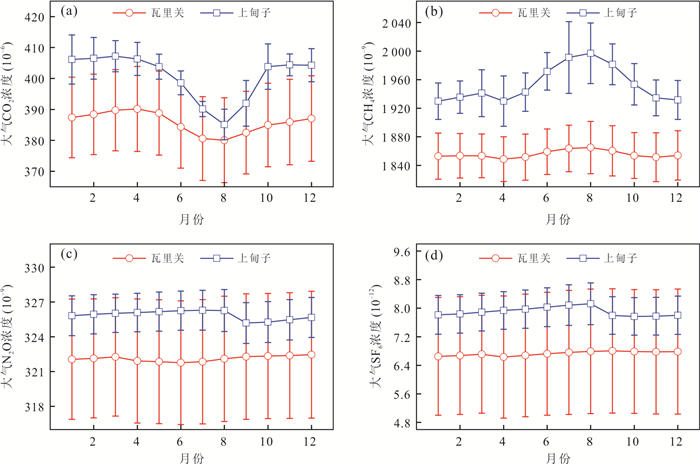
图 3 瓦里关和上甸子本底站大气温室气体的多年平均月浓度变化
Fig. 3. Multi-year average monthly concentration changes of atmospheric greenhouse gases at Waliguan and Shangdianzi background stations
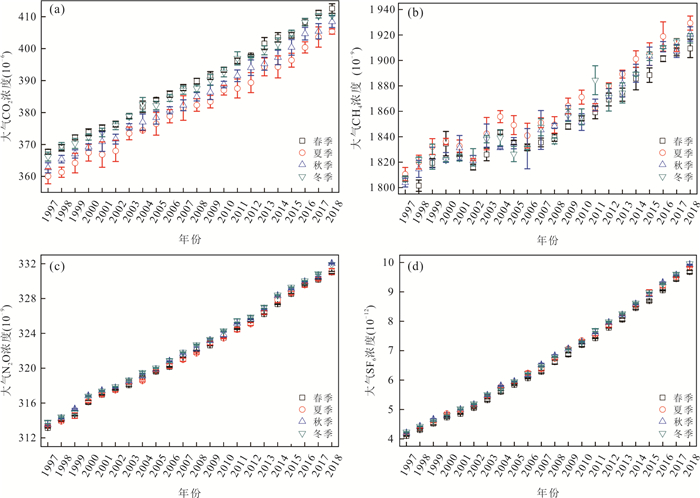
图 4 1997-2018年瓦里关本底站大气温室气体浓度的季节变化
Fig. 4. Seasonal variations of atmospheric greenhouse gases for 1997-2018 at Waliguan background station
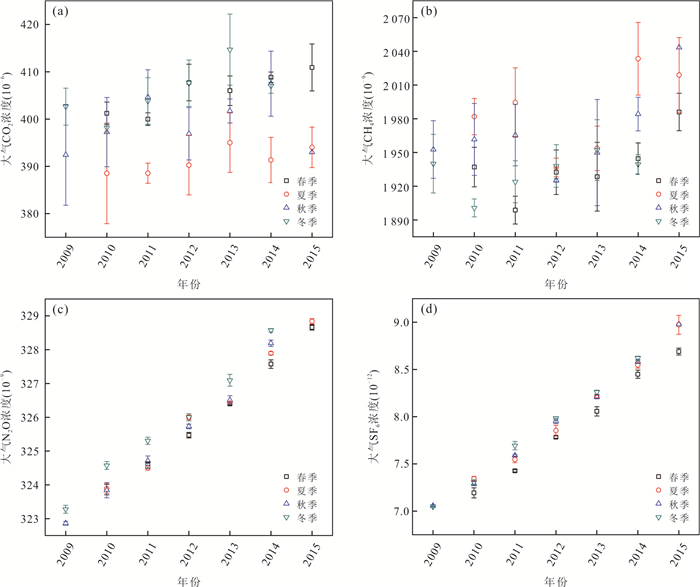
图 5 2009-2015年上甸子本底站大气温室气体浓度的季节变化
Fig. 5. Seasonal variations of atmospheric greenhouse gases for 2009-2015 at Shangdianzi background station
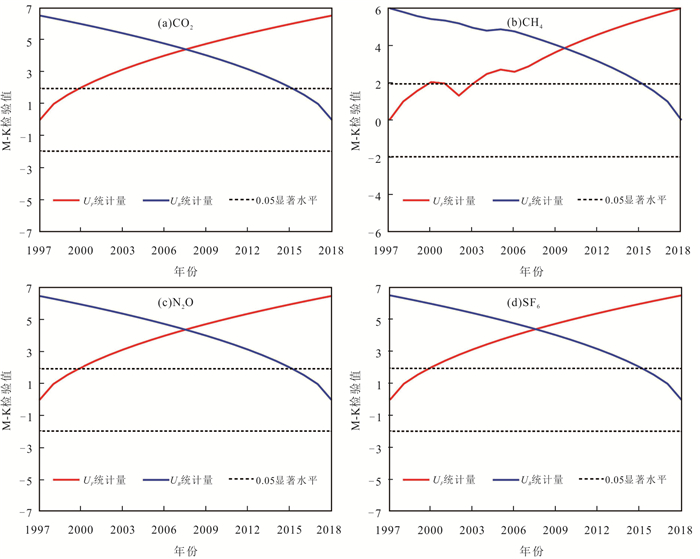
图 6 1997-2018年瓦里关本底站大气温室气体浓度的M-K突变检验曲线
Fig. 6. M-K mutation test curves of atmospheric greenhouse gases for 1997-2018 at Waliguan background station
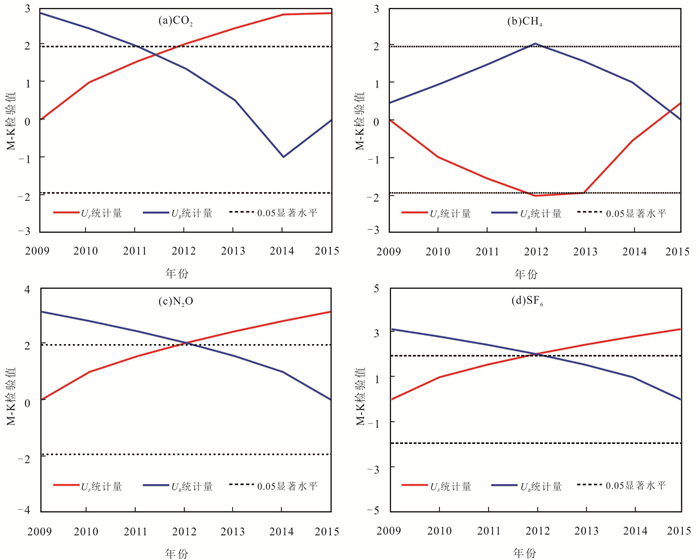
图 7 2009-2015年上甸子本底站大气温室气体浓度的M-K突变检验曲线
Fig. 7. M-K mutation test curves of atmospheric greenhouse gases for 2009-2015 at Shangdianzi background station
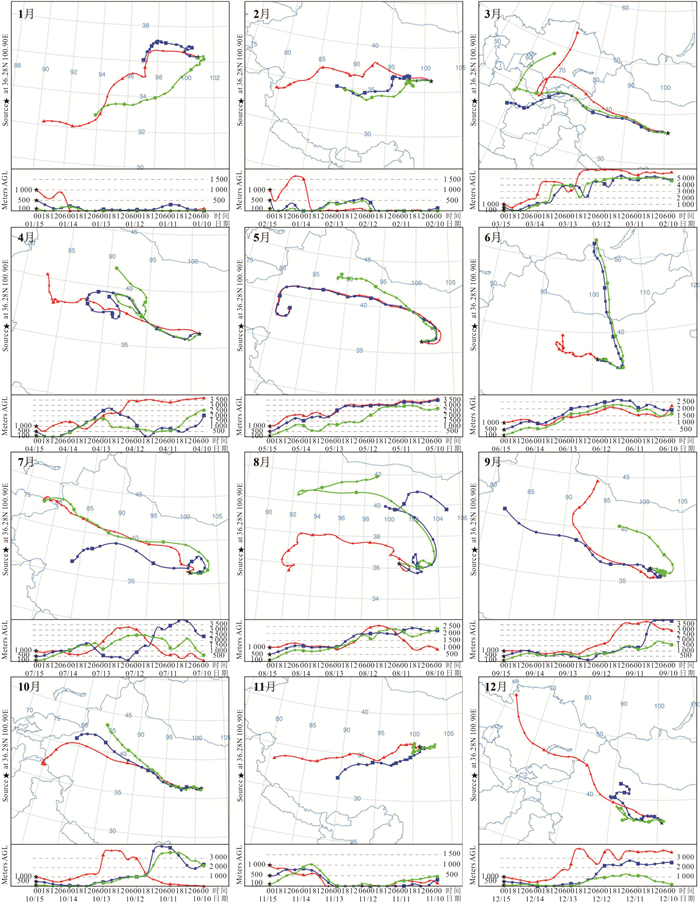
图 8 瓦里关本底站不同月份空气团120 h后向轨迹分析
绿线:100 m AGL;蓝线:500 m AGL;红线:1 000 m AGL
Fig. 8. 120 h backward trajectory analysis of air masses in different months at Waliguan background station
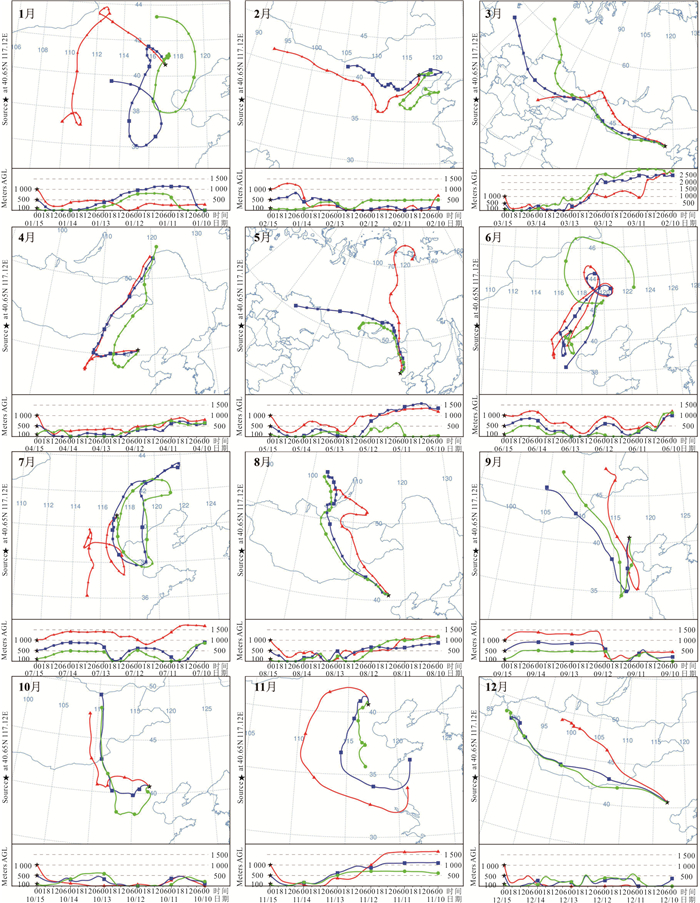
图 9 上甸子本底站不同月份120 h空气团后向轨迹分析
绿线:100 m AGL;蓝线:500 m AGL;红线:1 000 m AGL
Fig. 9. 120 h backward trajectory analysis of air masses in different months at Shangdianzi background station
表 1 中国瓦里关和上甸子本底站大气温室气体浓度的统计特征
Table 1. Statistical characteristics of atmospheric greenhouse gases concentration at Waliguan and Shangdianzi background stations in China
年份 CO2浓度(10‒6) CH4浓度(10‒9) N2O浓度(10‒9) SF6浓度(10‒12) 瓦里关 上甸子 瓦里关 上甸子 瓦里关 上甸子 瓦里关 上甸子 1997 363.95±3.14 ‒ 1 807.35±4.22 ‒ 313.40±0.17 ‒ 4.17±0.04 ‒ 1998 365.77±3.03 ‒ 1 812.10±8.35 ‒ 314.04±0.17 ‒ 4.35±0.07 ‒ 1999 368.29±3.32 ‒ 1 824.35±6.60 ‒ 314.75±0.36 ‒ 4.56±0.08 ‒ 2000 370.38±2.71 ‒ 1 829.99 ±7.98 ‒ 316.16±0.64 ‒ 4.77±0.09 ‒ 2001 371.40±3.69 ‒ 1 827.60±6.41 ‒ 317.08±0.23 ‒ 4.92±0.07 ‒ 2002 372.65±3.53 ‒ 1 820.42±3.62 ‒ 317.57±0.15 ‒ 5.11±0.05 ‒ 2003 376.23±2.26 ‒ 1 834.80±10.10 ‒ 318.28±0.29 ‒ 5.39±0.11 ‒ 2004 378.19±3.05 ‒ 1 841.88±9.56 ‒ 318.89±0.30 ‒ 5.69±0.11 ‒ 2005 380.42±3.59 ‒ 1 839.63±7.31 ‒ 319.71±0.17 ‒ 5.86±0.09 ‒ 2006 382.11±2.80 ‒ 1 832.50±9.60 ‒ 320.37±0.31 ‒ 6.13±0.10 ‒ 2007 384.21±3.09 ‒ 1 841.43±9.93 ‒ 321.27±0.32 ‒ 6.37±0.11 ‒ 2008 386.12±2.98 ‒ 1 846.09±5.76 ‒ 322.02±0.30 ‒ 6.69±0.13 ‒ 2009 387.39±3.27 396.29±11.39 1 852.91±10.48 1 958.42±24.37 322.88±0.26 322.93±0.13 6.97±0.11 7.06±0.01 2010 390.06±2.57 396.59±8.21 1 858.23±8.81 1 949.54±31.83 323.62±0.28 323.83±0.31 7.24±0.11 7.24±0.11 2011 392.26±3.52 397.76±6.67 1 862.64±4.72 1 939.14±47.39 324.69±0.37 324.66±0.20 7.50±0.11 7.50±0.11 2012 394.79±3.87 400.96±9.17 1 877.78±7.80 1 934.36±14.24 325.45±0.25 325.69±0.25 7.85±0.10 7.85±0.10 2013 397.21±3.36 401.86±5.90 1 878.60±9.75 1 938.85±33.39 326.41±0.34 326.42±0.22 8.14±0.10 8.14±0.10 2014 398.74±3.88 405.70±10.33 1 888.62±11.17 1 980.25±39.87 327.76±0.51 327.82±0.40 8.49±0.12 8.49±0.12 2015 400.97±3.31 402.60±8.86 1 897.82±9.44 1 993.68±39.72 328.74±0.31 328.72±0.12 8.83±0.15 8.80±0.17 2016 404.86±3.14 ‒ 1 908.96±8.65 ‒ 329.64±0.26 ‒ 9.17±0.13 ‒ 2017 407.34±3.42 ‒ 1 909.17±3.93 ‒ 330.29±0.24 ‒ 9.47±0.11 ‒ 2018 409.23±2.85 ‒ 1 918.76±8.55 ‒ 331.33±0.50 ‒ 9.80±0.13 ‒  下载: 导出CSV
表 2 不同季节瓦里关和上甸子本底站四种大气温室气体浓度的皮尔逊相关性系数
Table 2. Pearson correlation coefficients of four greenhouse gases concentrations at Waliguan and Shangdianzi background stations in different seasons
春季 夏季 秋季 冬季 全年 CO2 CH4 N2O SF6 CO2 CH4 N2O SF6 CO2 CH4 N2O SF6 CO2 CH4 N2O SF6 CO2 CH4 N2O SF6 瓦里关本底站 CO2 1.000 1.000 1.000 1.000 1.000 CH4 0.959** 1.000 0.934** 1.000 0.942** 1.000 0.958** 1.000 0.890** 1.000 N2O 0.996** 0.962** 1.000 0.979** 0.960** 1.000 0.992** 0.960** 1.000 0.994** 0.948** 1.000 0.967** 0.947** 1.000 SF6 0.996** 0.966** 0.997** 1.000 0.981** 0.964** 0.997** 1.000 0.991** 0.965** 0.997** 1.000 0.994** 0.956** 0.997** 1.000 0.961** 0.956** 0.997** 1.000 上甸子本底站 CO2 1.000 1.000 1.000 1.000 1.000 CH4 0.780** 1.000 ‒0.056 1.000 0.022 1.000 0.902** 1.000 ‒0.153 1.000 N2O 0.691** 0.602** 1.000 0.290 0.387 1.000 0.497* 0.108 1.000 0.492* 0.275 1.000 0.311** 0.315** 1.000 SF6 0.706** 0.591** 0.996** 1.000 0.240 0.423 0.987** 1.000 0.429 0.116 0.992** 1.000 0.553* 0.344 0.988** 1.000 0.245* 0.382** 0.986** 1.000 注:*代表0.05水平上相关性显著,**代表0.01水平上相关性显著.
下载: 导出CSV
-
Barry, R. G., Carleton, A. M., 2001. Synoptic and Dynamic Climatology. Taylor & Francis, London. https://doi.org/10.4324/9780203218181 Easterling, D. R., Meehl, G. A., Parmesan, C., et al., 2000. Climate Extremes: Observations, Modeling, and Impacts. Science, 289(5487): 2068-2074. https://doi.org/10.1126/science.289.5487.2068 IPCC, 2013. Climate Change 2013: The Physical Science Basis. In: Stocker, T.F., Qin, D., Plattner, G.K., et al., eds., Contribution of Working Group I to the Fifth Assessment Report of the Intergovernmental Panel on Climate Change. Cambridge University Press, Cambridge. Kendall, M.G., 1975. Rank Correlation Methods (4th Edition). Charles Griffin, London. Liu, L. X., Zhou, L. X., Vaughn, B., et al., 2014. Background Variations of Atmospheric CO2 and Carbon-Stable Isotopes at Waliguan and Shangdianzi Stations in China. Journal of Geophysical Research: Atmospheres, 119(9): 5602-5612. https://doi.org/10.1002/2013jd019605 Mann, H. B., 1945. Nonparametric Tests against Trend. Econometrica, 13(3): 245-259. https://doi.org/10.2307/1907187 Mu, L., Wu, D.X., Zhou, G., et al., 2007. Changes in Atlantic Thermohaline Circulation under Different Atmospheric CO2 Scenarios. Earth Science, 32(1): 141-146 (in Chinese with English abstract). National Climate Change Center, China Meteorological Administration, 2019. China Blue Book on Climate Change, 2019. National Climate Change Center, China Meteorological Administration, Beijing (in Chinese). NOAA, 2017. Trends in Atmospheric Carbon Dioxide. https://www.esrl.noaa.gov/gmd/ccgg/trends/gr.html Oke, T. R., 2002. Boundary Layer Climates. Psychology Press, London. https://doi.org/10.4324/9780203407219 Pu, W. W., Quan, W. J., Ma, Z. Q., et al., 2017. Long-Term Trend of Chemical Composition of Atmospheric Precipitation at a Regional Background Station in Northern China. Science of The Total Environment, 580: 1340-1350. https://doi.org/10.1016/j.scitotenv.2016.12.097 Rolph, G., Stein, A., Stunder, B., 2017. Real-Time Environmental Applications and Display System: READY. Environmental Modelling & Software, 95: 210-228. https://doi.org/10.1016/j.envsoft.2017.06.025 Shang, J., Yang, G., Yu, F.W., 2015. Agricultural Greenhouse Gases Emissions and Influencing Factors in China. Chinese Journal of Eco-Agriculture, 23(3): 354-364 (in Chinese with English abstract). http://en.cnki.com.cn/Article_en/CJFDTOTAL-ZGTN201503012.htm Stein, A. F., Draxler, R. R., Rolph, G. D., et al., 2015. NOAA's HYSPLIT Atmospheric Transport and Dispersion Modeling System. Bulletin of the American Meteorological Society, 96(12): 2059-2077. https://doi.org/10.1175/bams-d-14-00110.1 Stępalska, D., Myszkowska, D., Piotrowicz, K., et al., 2020. High Ambrosia Pollen Concentrations in Poland Respecting the Long Distance Transport (LDT). Science of The total Environment, 736: 139615. https://doi.org/10.1016/j.scitotenv.2020.139615 Wang, J. X., Rothausen, S. G. S. A., Conway, D., et al., 2012. China's Water-Energy Nexus: Greenhouse-Gas Emissions from Groundwater Use for Agriculture. Environmental Research Letters, 7(1): 014035. https://doi.org/10.1088/1748-9326/7/1/014035 Wang, Y. S., Zhou, L., Wang, M. X., et al., 2001. Trends of Atmospheric Methane in Beijing. Chemosphere-Global Change Science, 3(1): 65-71. https://doi.org/10.1016/s1465-9972(00)00022-2 Wei, F. Y., 2007. Modern Climate Statistical Diagnosis and Prediction Technology. China Meteorological Press, Beijing (in Chinese). WMO, 2019. Greenhouse Gas Bulletin (GHG Bulletin): The State of Greenhouse Gases in the Atmosphere Based on Global Observations through 2018. https://library.wmo.int/doc_num.php?explnum_id=10100, 2019-11-25 Xia, L.J., Zhou, L.X., Liu, L.X., et al., 2016. Monitoring Atmospheric CO2 and δ13C (CO2) Background Levels at Shangdianzi Station in Beijing, China. Environmental Science, 37(4): 1248-1255 (in Chinese with English abstract). http://www.researchgate.net/publication/304935113_Monitoring_atmospheric_CO2_and_d13CCO2_background_levels_at_Shangdianzi_station_in_Beijing_China Xing, Z.X., Yan, D.D., Liu, M.X., et al., 2015. Spatiotemporal Variability Analysis of Annual Precipitation in Sanjiang Plain in Recent Sixty Years. Transactions of the Chinese Society for Agricultural Machinery, 46(11): 337-344 (in Chinese with English abstract). http://www.cnki.com.cn/Article/CJFDTotal-NYJX201511046.htm Yang, Q., Guan, L., Tao, F., et al., 2018. Changes of CH4 Concentrations Obtained by Ground-Based Observations at Five Atmospheric Background Stations in China. Environmental Science & Technology, 41(6): 1-7 (in Chinese with English abstract). Zhang, D. Q., Tang, J., Shi, G. Y., et al., 2008. Temporal and Spatial Variations of the Atmospheric CO2 Concentration in China. Geophysical Research Letters, 35(3): L03801. https://doi.org/10.1029/2007gl032531 Zhang, F., Zhou, L. X., Xu, L., 2013. Temporal Variation of Atmospheric CH4 and the Potential Source Regions at Waliguan, China. Scientia Sinica Terrae, 43(4): 536-546 (in Chinese). doi: 10.1360/zd-2013-43-4-536 Zhang, X., Jiang, H., 2014. Spatial Variations in Methane Emissions from Natural Wetlands in China. International Journal of Environmental Science and Technology, 11: 77-86. https://doi.org/10.1007/s13762-013-0385-y Zhou, C., Shi, R.H., Gao, W., 2015. Comparison of Carbon Dioxide in Mid-Troposphere and Near-Surface. Journal of Geo-Information Science, 17(11): 1286-1293 (in Chinese with English abstract). Zhou, C., Shi, R. H., Liu, C. S., et al., 2013. A Correlation Analysis of Monthly Mean CO2 Retrieved from the Atmospheric Infrared Sounder with Surface Station Measurements. International Journal of Remote Sensing, 34(24): 8710-8723. https://doi.org/10.1080/01431161.2013.847295 Zhou, L. X., White, J. W. C., Conway, T. J., et al., 2006. Long-Term Record of Atmospheric CO2 and Stable Isotopic Ratios at Waliguan Observatory: Seasonally Averaged 1991-2002 Source/Sink Signals, and a Comparison of 1998-2002 Record to the 11 Selected Sites in the Northern Hemisphere. Global Biogeochemical Cycles, 20(2): GB2001. https://doi.org/10.1029/2004gb002431 Zhou, L.X., Zhou, X.J., Zhang, X.C., et al., 2007. Progress in the Study of Background Greenhouse Gases at Waliguan Observatory. Acta Meteorologica Sinica, 65(3): 458-468 (in Chinese with English abstract). http://en.cnki.com.cn/Article_en/CJFDTOTAL-QXXB200703013.htm 牟林, 吴德星, 周刚, 等, 2007. 温室气体浓度增加情景下大西洋温盐环流的演变. 地球科学, 32(1): 141-146. http://www.earth-science.net/article/id/1677 尚杰, 杨果, 于法稳, 2015. 中国农业温室气体排放量测算及影响因素研究. 中国生态农业学报, 23(3): 354-364. https://www.cnki.com.cn/Article/CJFDTOTAL-ZGTN201503012.htm 魏风英, 2007. 现代气候统计诊断与预测技术. 北京: 气象出版社. 夏玲君, 周凌晞, 刘立新, 等, 2016. 北京上甸子站大气CO2及δ13C(CO2)本底变化. 环境科学, 37(4): 1248-1255. https://www.cnki.com.cn/Article/CJFDTOTAL-HJKZ201604009.htm 邢贞相, 闫丹丹, 刘美鑫, 等, 2015. 三江平原近60年降水量时空变异特征分析. 农业机械学报, 46(11): 337-344. doi: 10.6041/j.issn.1000-1298.2015.11.046 杨倩, 官莉, 陶法, 等, 2018. 中国5个大气本底站观测的CH4浓度变化规律. 环境科学与技术, 41(6): 1-7. https://www.cnki.com.cn/Article/CJFDTOTAL-FJKS201806001.htm 张芳, 周凌晞, 许林, 2013. 瓦里关大气CH4浓度变化及其潜在源区分析. 中国科学: 地球科学, 43(4): 536-546. https://www.cnki.com.cn/Article/CJFDTOTAL-JDXK201304005.htm 中国气象局国家气候变化中心, 2019. 中国气候变化蓝皮书(2019). 北京: 中国气象局国家气候变化中心. 周聪, 施润和, 高炜, 2015. 对流层中层与近地面大气二氧化碳浓度的比较研究. 地球信息科学学报, 17(11): 1286-1293. https://www.cnki.com.cn/Article/CJFDTOTAL-DQXX201511004.htm 周凌晞, 周秀骥, 张晓春, 等, 2007. 瓦里关温室气体本底研究的主要进展. 气象学报, 65(3): 458-468. doi: 10.3321/j.issn:0577-6619.2007.03.014 -

 点击查看大图
计量
- 文章访问数: 1282
- HTML全文浏览量: 1286
- PDF下载量: 90
- 被引次数: 0
