


Identification of Rocky Ledge on Steep and High Slopes Based on Aerial Photogrammetry
-
摘要: 高陡边坡上的突岩容易在自重、地震、开挖卸荷等作用下失稳,威胁到水利工程的安全.因此,对突岩进行早期调查具有重要意义,但由于水利枢纽区域面积较大,交通不便,人工调查耗时且危险.本文提出了一种基于航空影像的高陡边坡突岩快速识别方法.该方法主要包括3个步骤:(1)通过无人机摄影测量生成边坡点云模型;(2)使用核密度估计方法(KDE)对点云模型的赤平投影结果进行统计分析,以将点云模型分割成平滑区域和非平滑区域;(3)用一种基于密度且对噪声鲁棒的空间聚类算法(DBSCAN)对非平滑区域的点进行聚类,以识别代表突岩的点簇.该方法可以从整个边坡识别多个突岩,有效减少人工工作量,将该方法应用到两河口水电站某自然边坡的突岩识别中,可较为方便地得到岩体的边界和几何要素,为下一步稳定分析提供基本数据.Abstract: The rocky ledge on steep, high slopes is easy to lose stability under the action of gravity, earthquake, excavation and unloading, etc., which threatens the safety of water conservancy projects. Therefore, the early investigation of rocky ledge is of great significance. However, due to the large slope area and inconvenient traffic, the manual identification is time-consuming and dangerous. A rapid identification method for the rock ledge based on unmanned aerial vehicle (UAV) photogrammetry is proposed in this paper. This method consists of three steps: (1) Generate the point cloud model by UAV photogrammetry; (2) segment the slopes into smooth areas and non-smooth areas by kernel density estimation (KDE) of the point's normal vector, clustering the points of non-smooth areas by the density-based spatial clustering of applications with noise (DBSCAN); (3) classify the point clusters representing rocky ledge by the geometric feature. The method can identify possible rocky ledge from the whole slope, which reduces the artificial workload. The proposed method has been successfully applied to the slopes near Lianghekou hydropower station to obtain boundaries and geometric features of rocky ledges which will provide basic data for the future stability analysis.
-
Key words:
- high-steep slope /
- rocky ledge /
- aerial photogrammetry /
- point cloud /
- kernel density estimation /
- DBSCAN /
- engineering geology /
- slope stability
-
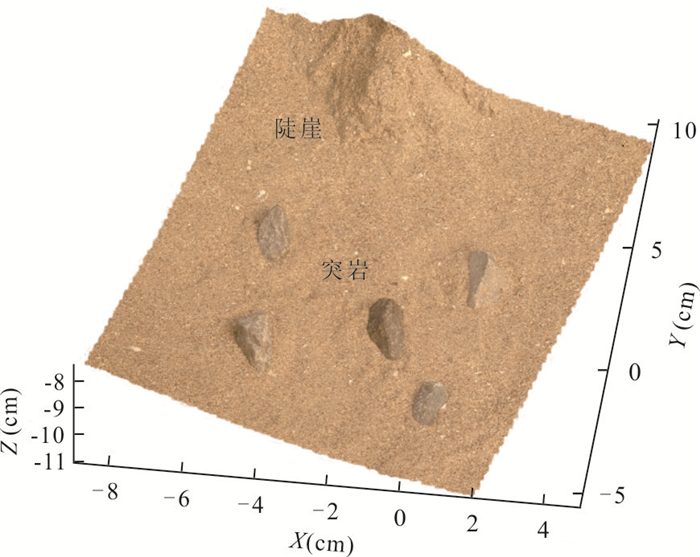
图 1 室内模型的三维点云模型,共34 583个点
Fig. 1. Dense point cloud model of the sand table surface, totaling 34 583 points
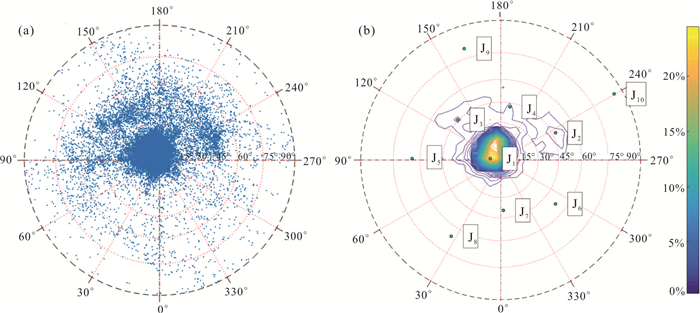
图 5 简化沙盘三维点数据集的赤平投影(a),简化实验三维点数据集的极点密度有10个局部极大值(b)
相邻等值线差值为1.25%
Fig. 5. Stereographic projection of the simplified experimental 3D point datasets (a); poles density of the simplified experimental 3D point datasets (b)
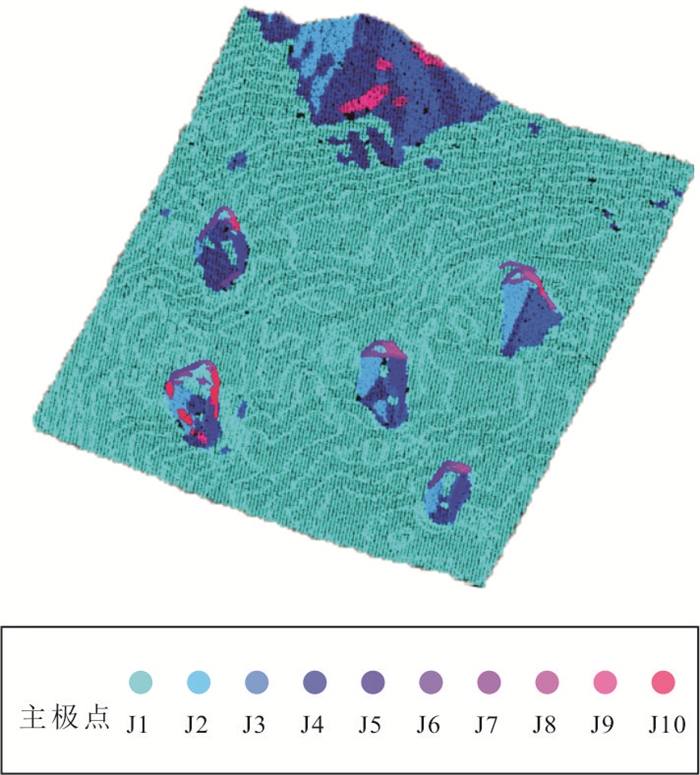
图 6 沙盘表面与不同极点相对应的点($ {\gamma }_{\mathrm{m}\mathrm{a}\mathrm{x}}=30° $)
Fig. 6. Points associated with different poles on the surface of the sand table ($ {\gamma }_{\mathrm{m}\mathrm{a}\mathrm{x}}=30° $)
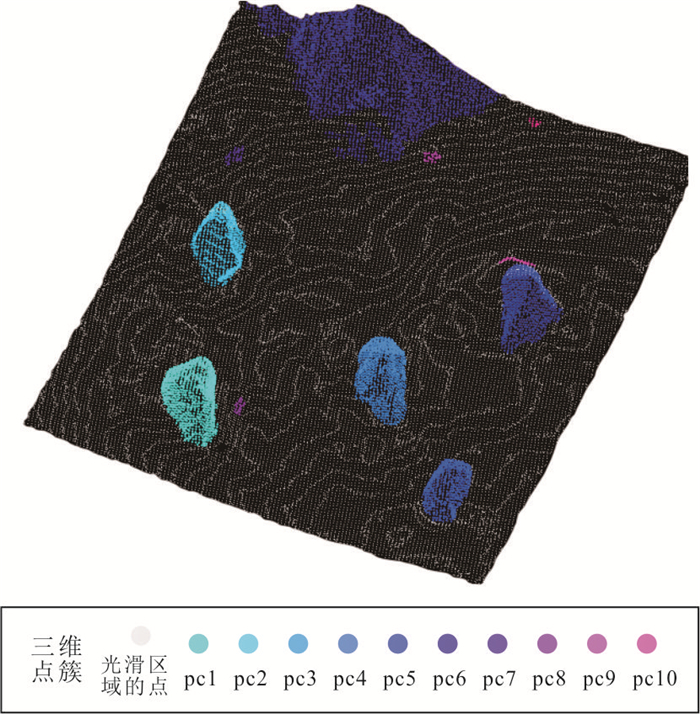
图 7 非平滑区域点的聚类结果(pcc=30)
Fig. 7. Clustering results of points on non-smooth areas of the sand table surface ($ pcc=30 $)
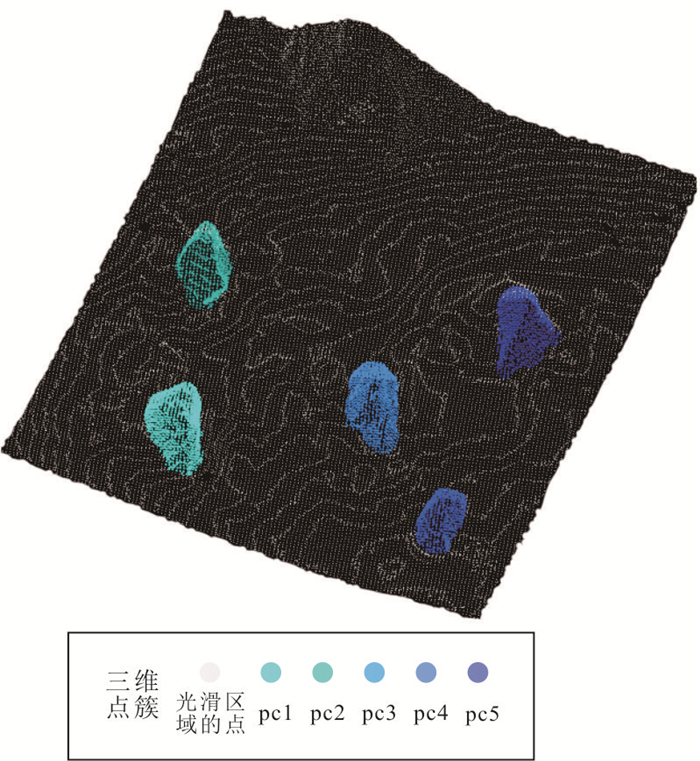
图 8 沙盘模型中代表突岩的点簇($ S{P}_{\mathrm{m}\mathrm{i}\mathrm{n}}=0.2 $)
Fig. 8. Point clusters representing the rock headlands on the sand table model ($ S{P}_{\mathrm{m}\mathrm{i}\mathrm{n}}=0.2 $)
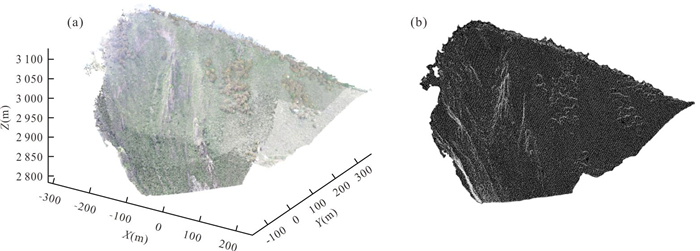
图 9 自然边坡的三维点云模型
a. 进行地理信息匹配后的点云;b. 滤噪后简化点云
Fig. 9. 3D point model of the natural slope
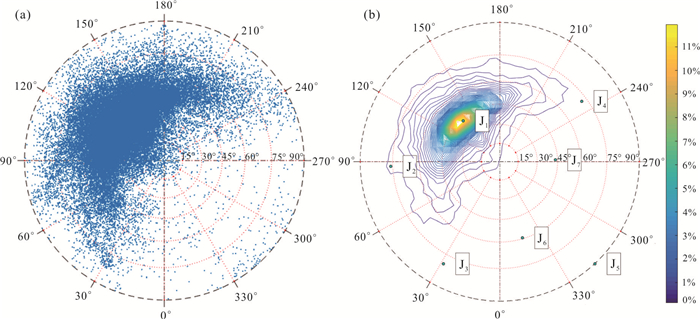
图 10 自然边坡的极点密度计算
a. 自然边坡的赤平投影(极点数:73 140);b. 自然边坡的极点密度,相邻等值线差值为1.25%
Fig. 10. Calculation of the density of the pole of the natural slope

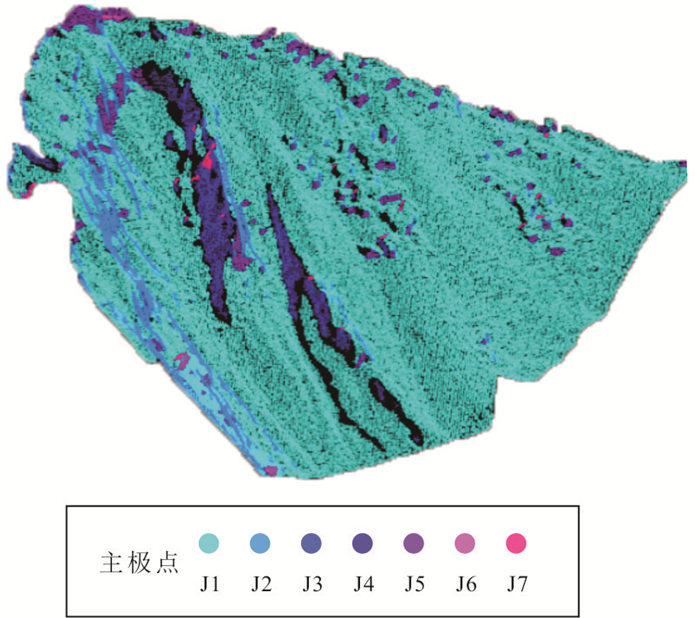
图 11 极点分类的赤平投影图
有69 869个极点按$ {\gamma }_{\mathrm{m}\mathrm{a}\mathrm{x}}=36 $分类
Fig. 11. Stereographic projection assigned principal poles
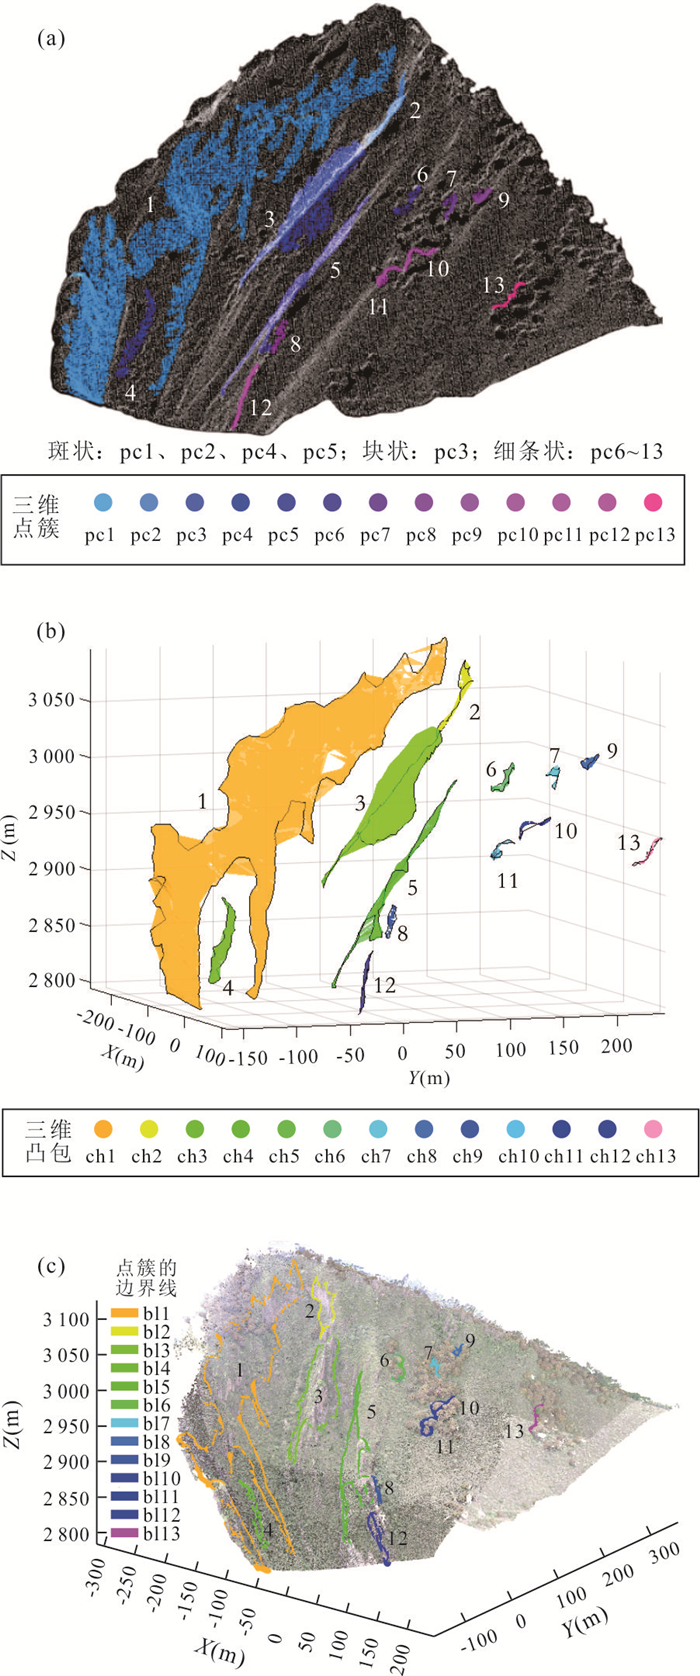
图 13 自然边坡点云的聚类和分类结果
a. 非平滑区域的聚类结果;b. 点簇形成的凸包;c. 点簇的边界线,bl13为突岩边界线,
Fig. 13. The clustering and classification results of point clouds of the natural slope

图 14 点簇对应部位实际照片
a. pc2的照片;b. pc6、pc7、pc9的照片
Fig. 14. Photos of the corresponding locations of the point cluster
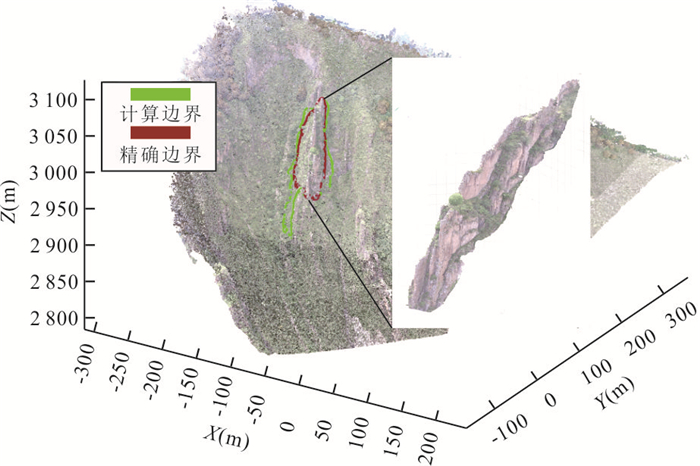
图 15 计算边界和精确边界的比较
Fig. 15. The comparison between the calculated boundary and the accurate boundary
表 1 沙盘简化点云各主极点的倾角与倾角方向
Table 1. Dip angle and dip direction of each principle pole of the sand table model
主极点 倾向(°) 倾角(°) J1 97 8 J2 243 47 J3 133 45 J4 189 42 J5 90 64 J6 308 53 J7 366 39 J8 32 66 J9 161 7 J10 239 86  下载: 导出CSV
表 2 自然边坡各主极点的倾角与倾向
Table 2. Dip angle and dip direction of each principle pole of the natural slope
主极点 倾向(°) 倾角(°) J1 138 43 J2 88 76 J3 29 80 J4 234 72 J5 317 90 J6 343 59 J7 268 43
下载: 导出CSV
表 3 属于不同主极点的极点比例
Table 3. Proportion of poles belonging to different principal poles
主极点 比例(%) J1 76.15 J2 10.36 J3 2.37 J4 3.19 J5 2.87 J6 0.20 J7 0.50
下载: 导出CSV
表 4 各点簇的几何参数计算结果
Table 4. Geometric parameters calculation results of each point cluster
点簇 体积(m3) 表面积(m2) SP pc1 40 351.84 62 096.68 0.09 pc2 1 209.49 3 455.72 0.16 pc3 59 009.42 15 846.69 0.46 pc4 793.47 1 806.27 0.23 pc5 4 521.55 9 336.69 0.14 pc6 44.16 311.16 0.19 pc7 25.99 200.06 0.21 pc8 35.01 232.50 0.22 pc9 7.67 133.76 0.14 pc10 28.07 275.10 0.16 pc11 35.65 267.43 0.20 pc12 508.80 1 338.01 0.23 pc13 22.08 205.83 0.18
下载: 导出CSV
-
Bezdek, J. C., 1981. Pattern Recognition with Fuzzy Objective Function Algorithms. Springer, Boston. https://doi.org/10.1007/978-1-4757-0450-1 Durney, D. W., 2002. The Techniques of Modern Structural Geology, Volume 3: Applications of Continuum Mechanics in Structural Geology. Tectonophysics, 344(3-4): 307-310. https://doi.org/10.1016/s0040-1951(01)00270-0 Eker, R., Aydın, A., Hübl, J., 2018. Unmanned Aerial Vehicle (UAV)-Based Monitoring of a Landslide: Gallenzerkogel Landslide (Ybbs-Lower Austria) Case Study. Environmental Monitoring and Assessment, 190(1): 1-14. https://doi.org/10.1007/s10661-017-6402-8 Ester, M., Kriegel, H. P., Sander, J., et al., 1996. A Density-Based Algorithm for Discovering Clusters in Large Spatial Databases with Noise. The Second International Conference on Knowledge Discovery and Data Mining, Portland. Greif, V., Vlcko, J., 2017. Kinematic Analysis of a Rock Slope at Strecno Castle (Slovakia) Based on the Processing of the Point Cloud Generated by UAV Photogrammetry. In: Mikos, M., Tiwari, B., Yin, Y., et al., eds., Advancing Culture of Living with Landslides. Springer, Cham. https://doi.org/10.1007/978-3-319-53498-5_48 Harwin, S., Lucieer, A., 2012. Assessing the Accuracy of Georeferenced Point Clouds Produced via Multi-View Stereopsis from Unmanned Aerial Vehicle (UAV) Imagery. Remote Sensing, 4(6): 1573-1599. https://doi.org/10.3390/rs4061573 Kaufman, L., Rousseeuw, P. J., 1990. Finding Groups in Data: An Introduction to Cluster Analysis. John Wiley, New York. Kennedy, C., Hutchinson, D. J., Lato, M., 2014. Consideration of Lidar and Photogrammetric Data Analysis Resulting from Challenging Data Collection. The 48th U. S. Rock Mechanics/Geomechanics Symposium, Minnesota. Kong, D. H., Wu, F. Q., Saroglou, C., 2020. Automatic Identification and Characterization of Discontinuities in Rock Masses from 3D Point Clouds. Engineering Geology, 265: 105442. https://doi.org/10.1016/j.enggeo.2019.105442 Li, H., Yu, Z. D., Cai, X. B., et al., 2017. River Terrace Extraction Based on Unmanned Aerial Vehicle Remote Sensing. Earth Science, 42(5): 734-742 (in Chinese with English abstract). Lu, Z. E., Tian, Y. G., Liu, Q. W., et al., 2021. Topographical Linear Feature Extraction Method Based on Sentinel-1 and DEM in Areas with High Vegetation Coverage of Nanling. Earth Science, 46(4): 1349-1358 (in Chinese with English abstract). Ma, H. C., 2011. Review on Applications of LiDAR Mapping Technology to Geosciences. Earth Science, 36(2): 347-354 (in Chinese with English abstract). Macqueen, J. B., 1967. Some Methods for Classification and Analysis of Multivariate Observations. The 5th Berkeley Symposium on Mathematical Statistics and Probability, Berkeley. Mora, C. F., Kwan, A. K. H., 2000. Sphericity, Shape Factor, and Convexity Measurement of Coarse Aggregate for Concrete Using Digital Image Processing. Cement and Concrete Research, 30(3): 351-358. https://doi.org/10.1016/S0008-8846(99)00259-8 Pauly, M., Gross, M., Kobbelt, L. P., 2002. Efficient Simplification of Point-Sampled Surface. IEEE Visualization 2002 Conference, Boston. https://doi.org/10.1109/VISUAL.2002.1183771 Qiu, J. L., Xia, Q. L., Yao, L. Q., et al., 2012. Mine Geological Modeling and Application Based on the Three-Dimensional Laser Scanner Technology. Earth Science, 37(6): 1209-1216 (in Chinese with English abstract). Riquelme, A. J., Abellán, A., Tomás, R., et al., 2014. A New Approach for Semi-Automatic Rock Mass Joints Recognition from 3D Point Clouds. Computers & Geosciences, 68: 38-52. https://doi.org/10.1016/j.cageo.2014.03.014 Sabapathy, R., Sastry, V. R., Murthy, D. C. S. N., 2013. Mapping of Geological Discontinuity Using SIROVISION: A Case Study. National conference on "Present Technology and Safety Scenario in Mining & Allied Industries", Varanasi. Shi, X. G., Xu, J. H., Jiang, H. J., et al., 2019. Slope Stability State Monitoring and Updating of the Outang Landslide, Three Gorges Area with Time Series InSAR Analysis. Earth Science, 44(12): 4284-4292 (in Chinese with English abstract). Silverman, B. W., 1986. Density Estimation for Statistics and Data Analysis. Chapman and Hall, London. Tonini, M., Abellan, A., 2014. Rockfall Detection from Terrestrial LiDAR Point Clouds: A Clustering Approach Using R. Journal of Spatial Information Science, (8): 95-110. https://doi.org/10.5311/josis.2014.8.123 Verhoeven, G., 2011. Taking Computer Vision Aloft: Archaeological Three-Dimensional Reconstructions from Aerial Photographs with Photoscan. Archaeological Prospection, 18(1): 67-73. https://doi.org/10.1002/arp.399 Wang, M., Li, L. H., Liao, X. H., et al., 2019. Rapid Topographic Measurement and Three-Dimensional Numerical Modeling Method for High-Steep/Upright Slopes Based on Aerial Photography of Uav. Journal of Engineering Geology, 27(5): 1000-1009 (in Chinese with English abstract). Wang, S. Y., Tang, C., He, J., et al., 2016. Use of Unmanned Aerial Vehicle for Precise Investigation of Geological Hazard in Strong Seismic Zone. Journal of Engineering Geology, 24(4): 713-719 (in Chinese with English abstract). Zhang, K., Wu, F. Q., Sha, P., et al., 2019. Geological Cataloging Method with Oblique Photography of Uav for Open-Pit Slope and Its Application. Journal of Engineering Geology, 27(6): 1448-1455 (in Chinese with English abstract). Zhang, T. A., Ramakrishnan, R., Livny, M., 1996. Birch: An Efficient Data Clustering Method for Very Large. ACM SIGMOD Record, 25(2): 103-114. https://doi.org/10.1145/233269.233324 李辉, 余忠迪, 蔡晓斌, 等, 2017. 基于无人机遥感的河流阶地提取. 地球科学, 42(5): 734-742. doi: 10.3799/dqkx.2017.061 鲁泽恩, 田玉刚, 柳庆威, 等, 2021. 基于Sentinel-1和DEM数据的南岭高植被覆盖区地形线性特征提取方法. 地球科学, 46(4): 1349-1358. doi: 10.3799/dqkx.2020.351 马洪超, 2011. 激光雷达测量技术在地学中的若干应用. 地球科学, 36(2): 347-354. doi: 10.3799/dqkx.2011.037 邱俊玲, 夏庆霖, 姚凌青, 等, 2012. 基于三维激光扫描技术的矿山地质建模与应用. 地球科学, 37(6): 1209-1216. doi: 10.3799/dqkx.2012.129 史绪国, 徐金虎, 蒋厚军, 等, 2019. 时序InSAR技术三峡库区藕塘滑坡稳定性监测与状态更新. 地球科学, 44(12): 4284-4292. doi: 10.3799/dqkx.2019.180 王明, 李丽慧, 廖小辉, 等, 2019. 基于无人机航摄的高陡/直立边坡快速地形测量及三维数值建模方法. 工程地质学报, 27(5): 1000-1009. https://www.cnki.com.cn/Article/CJFDTOTAL-GCDZ201905008.htm 王帅永, 唐川, 何敬, 等, 2016. 无人机在强震区地质灾害精细调查中的应用研究. 工程地质学报, 24(4): 713-719. https://www.cnki.com.cn/Article/CJFDTOTAL-GCDZ201604033.htm 张恺, 伍法权, 沙鹏, 等, 2019. 基于无人机倾斜摄影的矿山边坡岩体结构编录方法与工程应用. 工程地质学报, 27(6): 1448-1455. https://www.cnki.com.cn/Article/CJFDTOTAL-GCDZ201906027.htm -


 点击查看大图
计量
- 文章访问数: 760
- HTML全文浏览量: 640
- PDF下载量: 63
- 被引次数: 0
