


Analysis of Influencing Factors of Aerosol Optical Depth in Beijing
-
摘要: 大气污染成分、道路分布情况、地表覆盖类型等是影响气溶胶光学厚度(aerosol optical depth,AOD)的主要因素,针对区域性的顾及多种影响因素的AOD研究意义重大.研究采用北京市2020年2月至2021年2月的高分辨率气溶胶光学厚度产品数据、大气污染数据、道路线数据、地表分类数据、NPP夜光遥感数据,提出了可拓展简化气溶胶反演算法(extensible simplified aerosol retrieval algorithm,XSARA),利用Pearson指数、主成分分析、多元回归、地理加权回归模型等方法,系统分析了北京市2020—2021年气溶胶光学厚度及其驱动因素.结果发现:①湿度与AOD呈正相关,而风力风向与AOD呈负相关,通过进行多元线性回归获得AOD和各组合因子的关系方程,其中R2为0.970 68,残差平方和为0.029 1,表明回归效果较好;②道路沿线范围的AOD均高于周边区域,并且随着道路愈加密集,AOD也随之升高;③以人造地表为代表的地表覆盖能够增强AOD浓度,而以植被为代表的地表覆盖则减弱AOD浓度;④通过采用夜间灯光数据,发现该数据与AOD的空间分布模式相关性很高,并且采用地理加权回归模型得到的R2大于0.9,进一步表明两者相关程度较高.Abstract: Aerosol optical depth (AOD) is influenced by atmospheric pollution composition, road distribution, and surface cover type, etc. It is significant to study AOD for a regional scale considering multiple influencing factors. The study uses the high-resolution aerosol optical depth product data, air pollution data, road route data, surface classification data, and NPP night-light remote sensing data from February 2020 to February 2021 in Beijing, and proposes the extensible simplified aerosol retrieval algorithm (XSARA), using Pearson index, principal component analysis, multiple regression, and geographically weighted regression model to systematically analyze the aerosol optical thickness and its driving factors in Beijing from 2020 to 2021. The results show follows (1) Humidity is positively correlated with AOD, while wind direction is negatively correlated with AOD. The relationship equation between AOD and each combination factor is obtained by multiple linear regression, in which R2 is 0.970 68 and the sum of squares of residuals is 0.029 10, indicating that the regression effect is good. (2) The AOD along the road is higher than the surrounding areas, and the AOD increases with the increasing density of the road. (3) The surface cover represented by man-made surface can enhance the AOD concentration, while the surface cover represented by vegetation can weaken the AOD concentration. (4) By using the night light data, it is found that the data has a high correlation with the spatial distribution pattern of AOD, and the R2 obtained by geographic weighted regression model is greater than 0.9, which further indicates that the correlation between the two is high.
-
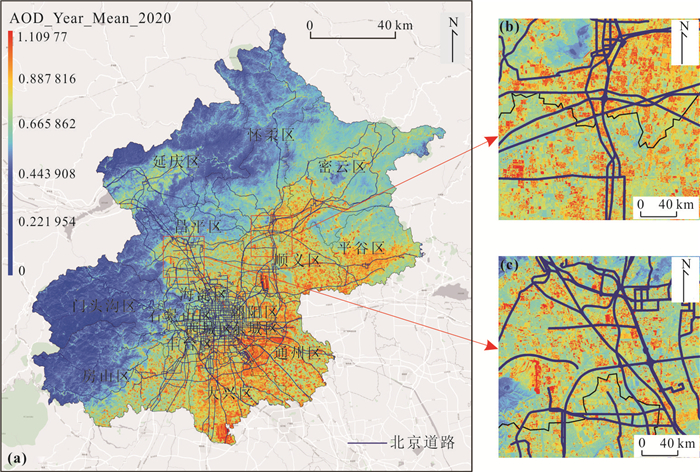
图 2 北京市年度AOD均值和主要道路分布
Fig. 2. Annual AOD mean and distribution of main roads in Beijing

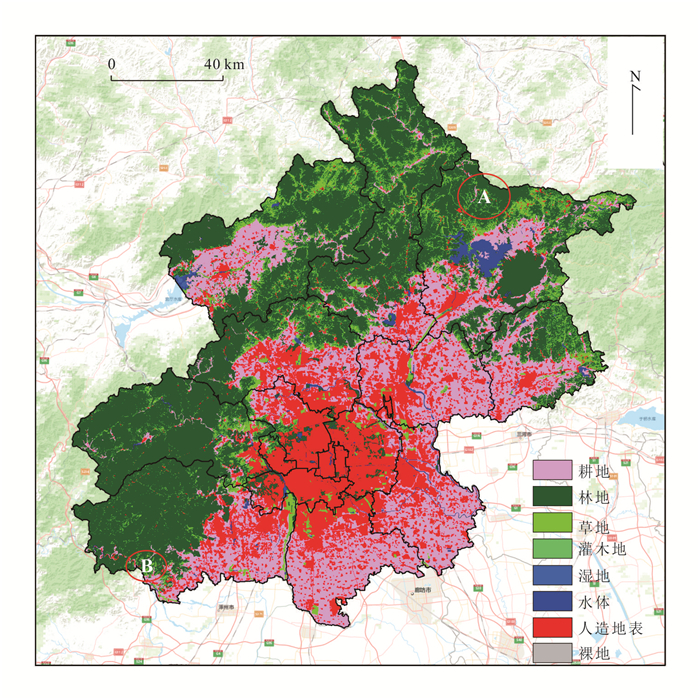
图 4 2020年北京市NPP夜光遥感数据空间分析
Fig. 4. Spatial analysis of NPP luminous remote sensing data in Beijing in 2020
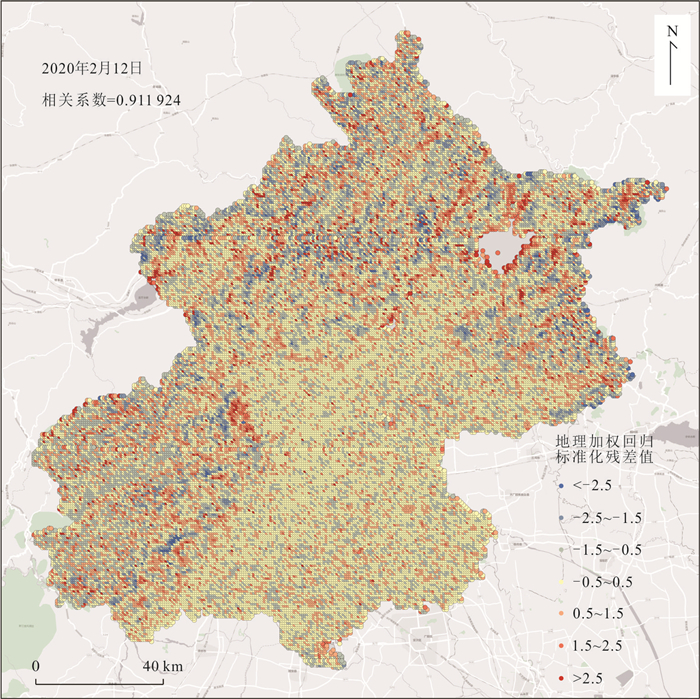
图 5 AOD-夜间灯光数据地理加权回归标准化残差空间分布
Fig. 5. Spatial distribution of normalized residuals of geographic weighted regression of AOD night light data
表 1 各因子Pearson相关系数
Table 1. Pearson correlation coefficients of each factor
因子类 因子 AOD A1 AOD 1.000 00 A2 细颗粒物(PM2.5)(μg/m3) 0.698 56 A3 二氧化硫(SO2) 0.520 80 A4 可吸入颗粒物(PM10) 0.389 04 A5 极大风速 -0.575 20 A6 极大风速的风向 -0.438 02 A7 平均相对湿度 0.470 27 A8 日照时数 -0.466 38 A9 最大风速 -0.589 73 A10 最大风速的风向 -0.639 09 A11 最小相对湿度 0.459 86  下载: 导出CSV
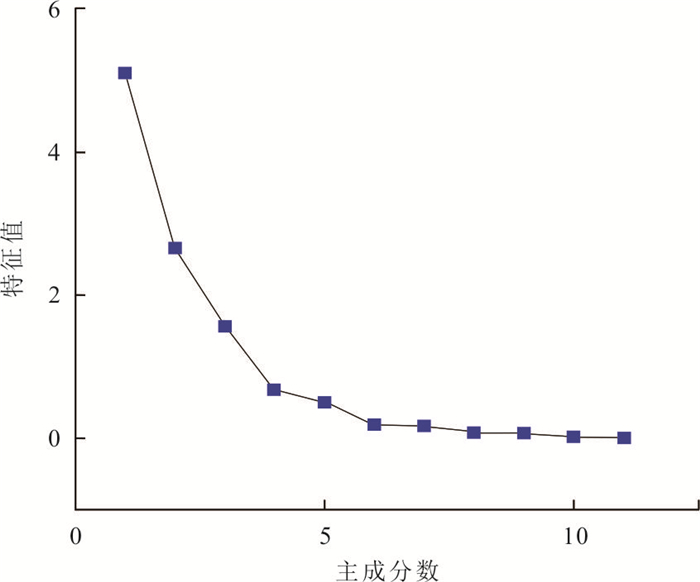
表 2 相关矩阵的特征值以及贡献率
Table 2. Eigenvalues and contribution rate of correlation matrix
因子类 特征值 方差百分比(%) 累积(%) A1 5.101 74 46.38 46.38 A2 2.656 79 24.15 70.53 A3 1.557 81 14.16 84.69 A4 0.669 20 6.08 90.78 A5 0.499 04 4.54 95.31 A6 0.186 35 1.69 97.01 A7 0.170 23 1.55 98.56 A8 0.074 44 0.68 99.23 A9 0.065 11 0.59 99.82 A10 0.018 69 0.10 99.99 A11 0.000 59 0.00 100.00
下载: 导出CSV
表 3 AOD多元线性各参数系数项
Table 3. AOD multivariate linear parameter coefficient terms
因子类 常数和自变量 系数 A1 常数 -6.133 68 A2 细颗粒物(PM2.5)(μg/m3) 0.013 43 A3 二氧化硫(SO2) 0.541 61 A4 可吸入颗粒物(PM10) 0.008 14 A5 极大风速 -0.283 81 A6 极大风速的风向 0.004 46 A7 平均相对湿度 0.018 65 A8 日照时数 0.311 32 A9 最大风速 0.437 19 A10 最大风速的风向 -0.004 29 A11 最小相对湿度 -0.011 76
下载: 导出CSV
-
Atkinson, K. E., 1978. An Introduction to Numerical Analysis. Wiley, New York. Bilal, M., Nichol, J. E., Bleiweiss, M. P., et al., 2013. A Simplified High Resolution MODIS Aerosol Retrieval Algorithm (SARA) for Use over Mixed Surfaces. Remote Sensing of Environment, 136: 135-145. https://doi.org/10.1016/j.rse.2013.04.014 Bilal, M., Nichol, J. E., Chan, P. W., 2014. Validation and Accuracy Assessment of a Simplified Aerosol Retrieval Algorithm (SARA) over Beijing under Low and High Aerosol Loadings and Dust Storms. Remote Sensing of Environment, 153: 50-60. https://doi.org/10.1016/j.rse.2014.07.015 He, Q. Q., Zhang, M., Huang, B., 2016. Spatio-Temporal Variation and Impact Factors Analysis of Satellite-Based Aerosol Optical Depth over China from 2002 to 2015. Atmospheric Environment, 129: 79-90. https://doi.org/10.1016/j.atmosenv.2016.01.002 Jing, Y., Sun, Y. L., Fu, H. C., et al., 2018. Temporal and Spatial Variation of Aerosol Optical Depth and Analysis of Influencing Factors in Beijing-Tianjin-Hebei Region from 2010 to 2016. Environmental Science & Technology, 41(8): 104-113 (in Chinese with English abstract). Kelley, C. T., 1995. Iterative Methods for Linear and Nonlinear Equations. Society for Industrial and Applied Mathematics, Philadelphia. Kumar, A., 2020. Spatio-Temporal Variations in Satellite Based Aerosol Optical Depths & Aerosol Index over Indian Subcontinent: Impact of Urbanization and Climate Change. Urban Climate, 32: 100598. https://doi.org/10.1016/j.uclim.2020.100598 Levy, R. C., Remer, L. A., Dubovik, O., 2007. Global Aerosol Optical Properties and Application to Moderate Resolution Imaging Spectroradiometer Aerosol Retrieval over Land. Journal of Geophysical Research: Atmospheres, 112(D13). Liang, S. L., 2004. Quantitative Remote Sensing of Land Surfaces. John Wiley and Sons, Inc., New York. Qin, W. M., Liu, Y., Wang, L. C., et al., 2018. Characteristic and Driving Factors of Aerosol Optical Depth over Mainland China during 1980-2017. Remote Sensing, 10(7): 1064. https://doi.org/10.3390/rs10071064 Ren, J. W., Wang, T., Chen, Y. L., et al., 2020. Research Status and Application Potential of CO2 Mineralization. Earth Science, 45(7): 2413-2425 (in Chinese with English abstract). Stocker, T., 2014. Climate Change 2013: The Physical Science Basis: Working Group I Contribution to the Fifth Assessment Report of the Intergovernmental Panel on Climate Change. Cambridge University Press, Cambridge. Xue, R., Ai, B., Lin, Y., et al., 2019. Spatial and Temporal Distribution of Aerosol Optical Depth and Its Relationship with Urbanization in Shandong Province. Atmosphere, 10(3): 110. doi: 10.3390/atmos10030110 Zhang, L., Jin, M. G., Liu, Y. F., et al., 2021. Concentration Variation Characteristics of Atmospheric Greenhouse Gases at Waliguan and Shangdianzi in China. Earth Science, 46(8): 2984-2998 (in Chinese with English abstract). Zhou, L., Zhou, C. H., Yang, F., et al., 2017. Spatio-Temporal Evolution and the Influencing Factors of PM2.5 in China between 2000 and 2011. Acta Geographica Sinica, 72(11): 2079-2092 (in Chinese with English abstract). 景悦, 孙艳玲, 付宏臣, 等, 2018.2010—2016年京津冀AOD时空变化及其影响因子分析. 环境科学与技术, 41(8): 104-113. https://www.cnki.com.cn/Article/CJFDTOTAL-FJKS201808016.htm 任京伟, 王涛, 陈雨雷, 等, 2020. CO2矿化研究现状及应用潜力. 地球科学, 45(7): 2413-2425 doi: 10.3799/dqkx.2020.027 张林, 靳孟贵, 刘延锋, 等, 2021. 中国瓦里关和上甸子大气温室气体浓度变化特征. 地球科学, 46(8): 2984-2998. doi: 10.3799/dqkx.2020.267 周亮, 周成虎, 杨帆, 等, 2017.2000—2011年中国PM2.5时空演化特征及驱动因素解析. 地理学报, 72(11): 2079-2092. https://www.cnki.com.cn/Article/CJFDTOTAL-ZGDE201902006.htm -

 点击查看大图
计量
- 文章访问数: 681
- HTML全文浏览量: 544
- PDF下载量: 36
- 被引次数: 0
