


Environmental Effects and Causes of Produced Water in Coalbed Methane Wells: Taking GP Well Cluster in Songhe Block of Western Guizhou as an Example
-
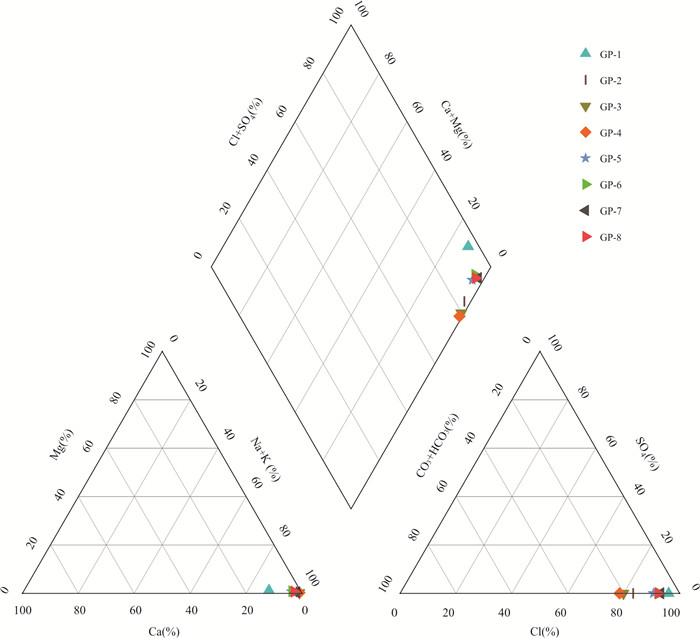
摘要: 随着煤层气产业的规模化发展,煤层气井产出水的环境效益备受重视.以贵州西部松河井组8口煤层气试验井为例,动态跟踪了2018年5批次产出水的地球化学数据,采用模糊综合评价法和单因素分析法进行了产出水环境效应评价并进行成因分析,得出以下结论:松河井组煤层气产出水地球化学特征主要表现为Na+、HCO3‒、Cl‒浓度高,矿化度较高,产出水型为Na-Cl和Na-HCO3-Cl.本文采用模糊综合评价法计算得出8口煤层气试验井产出水均属于Ⅴ级重度污染,并得出主要污染指标为TDS、Na+以及Cl‒,F元素、Mn元素轻微超标,在此基础上进行单因子分析,评价结果为重度污染.综合2种评价方法得出主要污染指标为TDS、Na+、Cl‒以及Ba2+.污染程度在一定范围内随时间变化表现出轻微波动且具有微弱的降低趋势,研究区煤层气井产出水污染等级高且随时间变化而波动变化,是地质因素、工程因素叠加影响的耦合结果.煤系地层中各种元素富集的高地质背景为根本影响因素,控制着微量元素的种类和含量,其次压裂液返排率的变化对其有显著影响作用,季节性降水则加强水岩作用,促进了元素的溶出.Abstract: With the large-scale development of coalbed methane industry, the environmental effects of produced water from coalbed methane wells receive more attention. Taking 8 coalbed methane test wells in Songhejing Formation in western Guizhou as an example, the geochemical data of 5 batches of produced water in 2018 were tracked dynamically, and the environmental effects of produced water were evaluated by fuzzy comprehensive evaluation method and single factor analysis method, and the causes were analyzed. The following conclusions were drawn: The geochemical characteristics of coalbed methane produced water in Songhejing Formation are mainly characterized by high concentration of Na+, HCO3‒ and Cl‒ and high salinity, and the produced water types are Na-Cl and Na-HCO3‒. In this paper, the fuzzy comprehensive evaluation method is used to calculate that the produced water of eight coalbed methane test wells belongs to grade V heavy pollution, and the main pollution indicators are TDS, Na+ and Cl‒, and the elements F and Mn slightly exceed the standard. On this basis, the single factor analysis shows that the evaluation result is heavy pollution. Two comprehensive evaluation methods show that the main pollution indicators are TDS, Na+, Cl‒ and Ba2+. In a certain range, the pollution degree fluctuates slightly with time and has a weak decreasing trend. The water pollution level of coalbed methane wells in the study area is high and fluctuates with time, which is the coupling result of the superposition of geological factors and engineering factors. The high geological background of various elements enrichment in coal measures strata is the fundamental influencing factor, which controls the types and contents of trace elements. Secondly, the change of fracturing fluid flowback rate has a significant effect. Seasonal precipitation strengthens the water-rock effect and promotes the dissolution of elements.
-

图 1 土城向斜构造纲要及井位分布
Fig. 1. Tucheng syncline structure outline and well location distribution
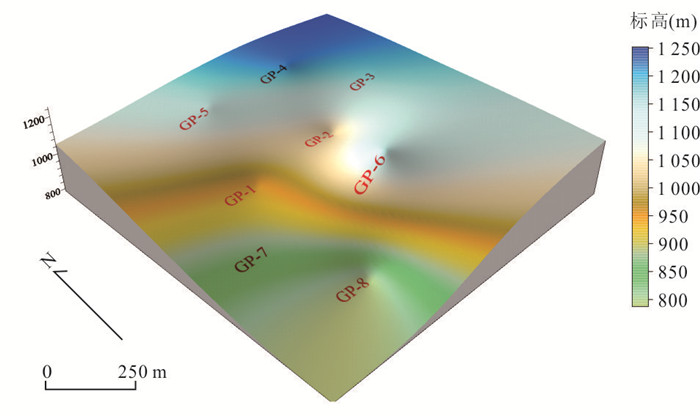
图 2 松河井组29-3煤层顶靶点标高图
Fig. 2. Elevation of coal target point 29-3 of Songhejing Formation
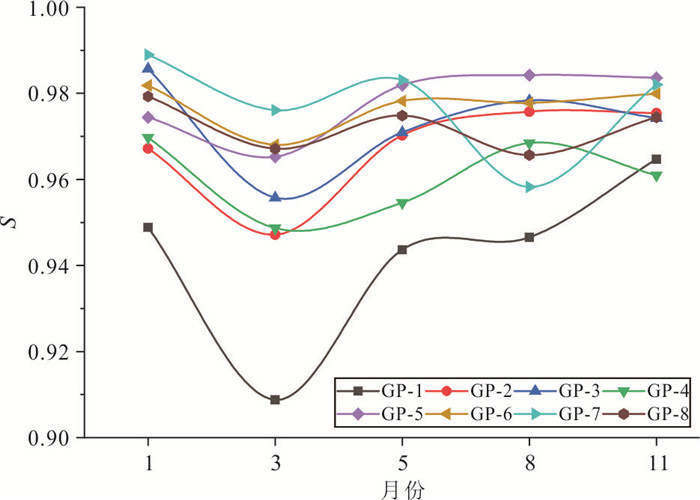
图 6 2018年8口井产出水模糊综合评价结果
Fig. 6. Fuzzy comprehensive evaluation results of produced water of 8 wells in 2018
表 1 松河煤层气井基本开发情况
Table 1. Basic development of coal bed methane wells in Songhe river
井号 井深 开发煤层 煤层总厚度
(m)水力压裂液注入量(m3) 煤层气累计产量(106m3) 累计产水量(m3) 投产时间 GP-1 847.00 6/9/12/13/15/16/29 18.8 3 559.2 0.52 3 043.99 2014.1 GP-2 764.00 1+3/5/9/10/11/13/15/16 14.4 3 616.8 0.59 2 731.04 2014.1 GP-3 610.00 6/9/12/13/15/29 15.7 3 538.7 0.66 1 463.37 2015.1 GP-4 564.50 6/9/13/15/16/29 16 2 261.0 0.60 1 235.08 2015.1 GP-5 654.00 1+3/4/5/6/9/13/15/29 22.8 4 083.0 0.61 1 514.00 2015.1 GP-6 617.00 1+3/4/5/6/9/15/16/26/27/29 28.1 4 688.5 0.78 1 800.48 2015.1 GP-7 902.00 1+3/4/5/12/15/27/29 19.1 3 782.3 0.34 2 209.58 2015.1 GP-8 977.08 1+3/4/5/12/13/15/26/27/29 25.75 4 574.2 0.45 2 326.25 2015.1 注:GP1井2018年1月改为1+3煤排采.  下载: 导出CSV
表 2 2018年1~11月份GP井组产出水常规阴阳离子平均质量浓度(10-6)
Table 2. Average mass concentration (10-6) of conventional cations in produced water of GP Well Group from January to November, 2018
井号 Ca K Na Mg Sr pH TDS F Cl SO4 HCO3 GP-1 237.90 193.91 1 665.76 24.63 14.86 6.95 3 288.60 0.57 3 059.55 0.04 123.21 GP-2 34.08 103.84 1 969.40 13.87 8.77 7.38 3 232.20 0.63 2 660.99 0.16 531.24 GP-3 21.08 132.73 2 803.51 9.76 9.37 7.60 4 024.20 0.93 3 641.42 0.23 916.84 GP-4 19.61 100.23 2 283.90 6.29 8.28 7.75 3 620.00 1.02 2 853.29 0.19 779.74 GP-5 92.86 166.75 2 532.44 18.47 14.30 7.45 4 046.20 0.55 3 777.30 0.17 390.40 GP-6 109.19 136.81 3 153.62 27.53 20.63 7.23 4 770.60 0.61 4 787.63 0.10 383.11 GP-7 64.59 456.61 3 202.33 17.36 16.96 7.40 4 914.60 0.82 4 869.58 0.36 357.21 GP-8 88.47 181.76 3 267.25 21.94 18.36 7.27 4 903.60 0.83 4 787.32 0.22 403.79
下载: 导出CSV
表 3 2018年1~11月份GP井组产出水微量元素平均质量浓度(10-9)
Table 3. Average mass concentration (10-9) of trace elements in produced water of GP Well Group from January to November, 2018
井号 As Cr Pd Hg Fe Cu Mn Zn Sb Mo Ni Ba Cd GP-1 0.759 0.301 0.039 0.262 280.000 0.819 331.100 11.112 0.098 2.395 1.953 9 248.000 - GP-2 0.688 0.211 0.025 0.205 20.460 0.949 23.810 5.065 0.092 23.53 0.658 5 417.000 - GP-3 1.127 0.320 0.022 0.223 16.220 1.491 8.480 8.768 0.071 2.764 8.430 10 670.000 - GP-4 0.832 0.282 0.019 0.181 21.490 1.168 21.200 5.729 0.068 2.709 7.687 6 936.000 - GP-5 0.836 0.183 0.028 0.149 57.189 1.514 62.636 9.530 0.039 0.773 8.170 10 167.451 - GP-6 1.217 0.251 0.022 0.125 58.588 2.083 172.186 13.041 0.095 3.939 1.332 14 739.729 - GP-7 1.092 0.270 0.012 0.092 34.322 1.906 116.179 13.242 0.101 13.552 1.993 16 085.985 - GP-8 1.252 0.294 0.017 0.177 54.187 1.751 187.594 11.908 0.075 8.910 1.843 15 049.775 - 注:“-”表示未检出.
下载: 导出CSV
表 4 研究区煤层气井产出水元素相关关系
Table 4. Correlation of elements in produced water of coalbed methane wells in the study area
TDS Cl Na F Fe Mn Cu Zn Al Hg As Cd Cr Pb TDS 1.00 Cl 0.98 1.00 Na 0.97 0.92 1.00 F 0.05 ‒0.08 0.13 1.00 Fe ‒0.35 ‒0.20 ‒0.53 ‒0.25 1.00 Mn 0.11 0.25 ‒0.10 ‒0.27 0.87 1.00 Cu 0.96 0.93 0.96 ‒0.04 ‒0.45 ‒0.04 1.00 Zn 0.90 0.96 0.79 ‒0.17 0.05 0.45 0.85 1.00 Al ‒0.63 ‒0.53 ‒0.69 0.13 0.80 0.50 ‒0.72 ‒0.33 1.00 Hg ‒0.72 ‒0.61 ‒0.77 ‒0.08 0.80 0.47 ‒0.77 ‒0.43 0.95 1.00 As 0.90 0.88 0.93 0.23 ‒0.31 0.11 0.87 0.79 ‒0.41 ‒0.50 1.00 Cd 0.37 0.29 0.27 0.17 ‒0.12 0.18 0.25 0.21 ‒0.45 ‒0.47 0.15 1.00 Cr 0.13 0.07 0.16 0.75 0.09 0.17 0.10 0.08 0.24 0.09 0.40 0.20 1.00 Pb ‒0.68 ‒0.57 ‒0.76 ‒0.04 0.85 0.50 ‒0.71 ‒0.34 0.93 0.94 ‒0.53 ‒0.43 0.16 1.00
下载: 导出CSV
表 5 GP井组水质评价指标(10‒9)
Table 5. Water Quality Evaluation Index of GP Well Group (10‒9)
井号 TDS(10‒6) Cl-
(10‒6)Na
(10‒6)F-(10‒6) Fe
(10‒9)Mn
(10‒9)Cu(10‒9) Zn
(10‒9)Al(10‒9) Hg(10‒9) As(10‒9) Cd(10‒9) Cr(10‒9) Pb(10‒9) GP-1 3 288.6 3 059.55 1 665.76 0.71 280.08 331.101 0.819 11.112 8.082 0.328 0.759 0.024 0.301 0.098 GP-2 3 232.2 2 660.99 1 969.40 0.63 20.46 23.810 0.949 6.331 4.102 0.205 0.688 0.024 0.211 0.041 GP-3 4 024.2 3 641.42 2 803.51 0.94 16.220 8.480 1.491 10.959 5.340 0.223 1.127 0.012 0.320 0.055 GP-4 3 620.0 2 853.29 2 283.90 1.02 21.495 21.199 1.168 7.161 3.919 0.181 0.832 0.038 0.353 0.049 GP-5 4 046.2 3 777.30 2 532.44 0.55 57.189 62.636 1.514 11.912 3.171 0.186 0.836 0.025 0.183 0.047 GP-6 4 770.6 4 787.63 3 209.70 0.62 58.588 172.186 2.083 16.302 2.734 0.155 1.217 0.030 0.314 0.037 GP-7 4 914.6 4 869.58 3 202.33 0.83 34.322 116.179 1.906 16.553 3.036 0.116 1.092 0.032 0.270 0.029 GP-8 4 903.6 4 787.32 3 267.26 0.83 54.187 187.594 1.751 14.885 3.645 0.177 1.252 0.037 0.294 0.029
下载: 导出CSV
表 6 地下水环境质量限值(10‒6)
Table 6. Limits of groundwater environmental quality (10‒6)
指标 Ⅰ类 Ⅱ类 Ⅲ类 Ⅳ类 Ⅴ类 TDS≤ 300 500 1 000 2 000 > 2 000 氯Cl≤ 50 150 250 350 > 350 钠Na≤ 100 150 200 400 > 400 氟F≤ 1 1 1 2 > 2 铁Fe≤ 0.1 0.2 0.3 2.0 > 2.0 锰Mn≤ 0.05 0.05 0.10 1.50 > 1.50 铜Cu≤ 0.01 0.05 1.00 1.50 > 1.50 锌Zn≤ 0.05 0.50 1.00 5.00 > 5.00 铝Al≤ 0.01 0.05 0.20 0.50 > 0.50 汞Hg≤ 0.000 1 0.000 1 0.001 0.002 > 0.002 砷As≤ 0.001 0.001 0.01 0.05 > 0.05 镉Cd≤ 0.000 1 0.001 0.005 0.01 0.01 铬Cr≤ 0.005 0.01 0.05 0.10 0.10 铅Pb≤ 0.005 0.005 0.01 0.10 0.10
下载: 导出CSV
表 7 松河井组水质模糊综合评价结果
Table 7. Fuzzy comprehensive evaluation results of water quality of Songhe Well Group
井号 Ⅰ级 Ⅱ级 Ⅲ级 Ⅳ级 Ⅴ级 所属级别 GP-1 0.024 15 0.013 01 0.029 86 0.003 48 0.929 50 Ⅴ级 GP-2 0.024 67 0.007 57 0.001 00 0 0.966 77 Ⅴ级 GP-3 0.023 44 0.007 46 0.000 95 0 0.968 15 Ⅴ级 GP-4 0.005 01 0.006 16 0.028 39 0.000 69 0.959 75 Ⅴ级 GP-5 0.016 98 0.007 60 0.001 35 0 0.974 06 Ⅴ级 GP-6 0.013 85 0.004 98 0.006 85 0.000 36 0.973 95 Ⅴ级 GP-7 0.016 85 0.004 01 0.004 64 0.000 05 0.974 44 Ⅴ级 GP-8 0.017 51 0.005 33 0.007 40 0.000 47 0.969 30 Ⅴ级
下载: 导出CSV
表 8 2018年松河井组全年模糊综合评价结果
Table 8. Fuzzy comprehensive evaluation results of Songhejing Formation in 2018
月份 井号 Ⅰ级 Ⅱ级 Ⅲ级 Ⅳ级 Ⅴ级 所属级别 1 GP-1 0.000 79 0.008 75 0.043 28 0.021 65 0.948 85 Ⅴ级 GP-2 0.025 20 0.007 44 0.000 17 0.000 00 0.967 19 Ⅴ级 GP-3 0.003 83 0.009 07 0.001 42 0.000 00 0.985 67 Ⅴ级 GP-4 0.017 81 0.009 86 0.002 59 0.000 00 0.969 74 Ⅴ级 GP-5 0.004 82 0.008 75 0.011 14 0.000 89 0.974 40 Ⅴ级 GP-6 0.002 51 0.007 28 0.008 05 0.000 32 0.981 85 Ⅴ级 GP-7 0.002 13 0.007 18 0.001 73 0.000 00 0.988 96 Ⅴ级 GP-8 0.003 02 0.007 24 0.009 70 0.000 77 0.979 26 Ⅴ级 3 GP-1 0.027 67 0.001 56 0.054 74 0.007 24 0.908 79 Ⅴ级 GP-2 0.025 97 0.013 87 0.014 30 0.000 00 0.947 12 Ⅴ级 GP-3 0.001 26 0.009 68 0.030 55 0.002 76 0.955 74 Ⅴ级 GP-4 0.002 34 0.008 99 0.026 48 0.013 49 0.948 70 Ⅴ级 GP-5 0.019 83 0.008 52 0.006 43 0.000 00 0.965 23 Ⅴ级 GP-6 0.017 01 0.005 76 0.008 72 0.000 48 0.968 04 Ⅴ级 GP-7 0.018 41 0.004 63 0.000 90 0.000 00 0.976 05 Ⅴ级 GP-8 0.019 80 0.004 88 0.007 72 0.000 47 0.967 14 Ⅴ级 5 GP-1 0.025 31 0.004 21 0.020 81 0.006 04 0.943 63 Ⅴ级 GP-2 0.023 34 0.005 92 0.000 50 0.000 00 0.970 25 Ⅴ级 GP-3 0.023 98 0.004 70 0.000 39 0.000 00 0.970 93 Ⅴ级 GP-4 0.003 73 0.005 05 0.024 80 0.011 88 0.954 54 Ⅴ级 GP-5 0.018 10 0.000 00 0.000 00 0.000 00 0.981 90 Ⅴ级 GP-6 0.015 72 0.000 00 0.005 81 0.000 25 0.978 22 Ⅴ级 GP-7 0.016 92 0.000 00 0.000 00 0.000 00 0.983 08 Ⅴ级 GP-8 0.016 70 0.002 96 0.005 32 0.000 19 0.974 84 Ⅴ级 8 GP-1 0.025 81 0.000 22 0.021 33 0.006 11 0.946 52 Ⅴ级 GP-2 0.024 26 0.000 00 0.000 00 0.000 00 0.975 74 Ⅴ级 GP-3 0.019 89 0.001 71 0.000 06 0.000 00 0.978 33 Ⅴ级 GP-4 0.031 58 0.000 00 0.000 00 0.000 00 0.968 42 Ⅴ级 GP-5 0.015 80 0.000 00 0.000 00 0.000 00 0.984 20 Ⅴ级 GP-6 0.011 85 0.001 36 0.008 21 0.000 83 0.977 76 Ⅴ级 GP-7 0.017 45 0.001 35 0.016 57 0.005 04 0.958 21 Ⅴ级 GP-8 0.020 23 0.001 53 0.011 14 0.001 44 0.965 67 Ⅴ级 11 GP-1 0.033 69 0.001 60 0.000 00 0.000 00 0.964 71 Ⅴ级 GP-2 0.024 64 0.000 00 0.000 00 0.000 00 0.975 36 Ⅴ级 GP-3 0.024 14 0.001 60 0.000 03 0.000 00 0.974 24 Ⅴ级 GP-4 0.004 79 0.001 69 0.025 16 0.007 42 0.960 94 Ⅴ级 GP-5 0.014 79 0.001 44 0.000 17 0.000 00 0.983 61 Ⅴ级 GP-6 0.013 10 0.001 81 0.005 11 0.000 09 0.979 88 Ⅴ级 GP-7 0.016 45 0.001 46 0.000 06 0.000 00 0.982 03 Ⅴ级 GP-8 0.015 54 0.005 15 0.004 85 0.000 06 0.974 40 Ⅴ级
下载: 导出CSV
表 9 环境质量评价分级表
Table 9. Grading table of environmental quality evaluation
等级 水质指数Ai 污染评价 1 Ai≤1 无污染 2 1 < Ai≤2 轻微污染 3 2 < Ai≤3 轻度污染 4 3 < Ai≤5 中度污染 5 Ai > 5 重度污染
下载: 导出CSV
表 10 8口试验井产出水单因子法评价结果
Table 10. Evaluation results of produced water of 8 test wells by single factor method
井名 污染因子 评价结果 污染等级 GP-1 Na+、Cl‒、Ba 5 重度污染 Mn、TDS 4 中度污染 GP-2 Na+、Cl‒、Ba 5 重度污染 TDS 4 中度污染 GP-3 Na+、Cl‒、Ba 5 重度污染 TDS 4 中度污染 GP-4 Na+、Cl‒、Ba 5 重度污染 TDS 4 中度污染 F 2 轻度污染 GP-5 Na+、Cl‒、Ba 5 重度污染 TDS 4 中度污染 GP-6 Na+、Cl‒、Ba 5 重度污染 TDS 4 中度污染 Mn 2 轻度污染 GP-7 Na+、Cl‒、Ba 5 重度污染 TDS 4 中度污染 Mn 2 轻度污染 GP-8 Na+、Cl‒、Ba 5 重度污染 TDS 4 中度污染 Mn 2 轻度污染
下载: 导出CSV
-
Ao, C. H., Zhong, J. S., Zhao, M., et al., 2020. Evaluation on Water Quality Evaluation of Baihua Lake Based on Fuzzy Comprehensive Method and Grey Correlation Method. Bulletin of Soil and Water Conservation, 40(1): 116-122, 129 (in Chinese with English abstract). Bao, J. H., Huang, Y., 2008. A Renew on Comprehensive Evaluation Methods of Water Quality. Water Conservancy Science and Technology and Economy, 14(8): 639-642 (in Chinese with English abstract). Brown, R. M., McClelland, N. I., Deininger, R. A., et al., 1970. A Water Quality Index-Do We Dare. Water and Sewage Works, 117(10): 339-343. Chen, J. M., Wu, Z. H., Liu, W. H., et al., 2021. Heavy Metal Pollution Evaluation and Species Analysis of Waste Rock Piles in Shuikoushan, Hunan Province. Earth Science, 46(11): 4127-4139 (in Chinese with English abstract). Dai, S. F., Ren, D. Y., Ma, S. M., 2004. The Cause of Endemic Fluorosis in Western Guizhou Province, Southwest China. Fuel, 83(14-15): 2095-2098. https://doi.org/10.1016/j.fuel.2004.03.016 Deng, J. L., 1984. Theory and Method of Socio-Economic Grey System. Social Sciences in China, (6): 47-60 (in Chinese with English abstract). Ding, S. L., 2001. Introduction to Environmental Assessment. Chemical Industry Press, Beijing, 88 (in Chinese). Fang, H. W., Sun, S. Q., Zhu, Y. L., et al., 2009. Principal Component Analysis Apply in Water Quality Assessment. Environmental Science and Management, 34(12): 152-154 (in Chinese with English abstract). Feng, X. B., Qiu, G. L., 2008. Mercury Pollution in Guizhou, Southwestern China: An Overview. Science of the Total Environment, 400(1-3): 227-237. https://doi.org/10.1016/j.scitotenv.2008.05.040 Jiang, L., Liu, C. Y., Wang, H. J., et al., 2021. Domestic and Foreign Environmental Management of Shale Gas Development: Status and Comparison. Natural Gas Industry, 41(12): 146-155 (in Chinese with English abstract). Jin, J., Yang, Z. B., Qin, Y., et al., 2022. Progress, Potential and Prospects of CBM Development in Guizhou Province. Journal of China Coal Society, 47(11): 4113-4126 (in Chinese with English abstract). Li, Q. G., Wu, P., Gu, S. Y., et al., 2019. Pollution Characteristics of Toxic and Harmful Elements and Its Environmental Impact in Water Co-Produced from Coalbed Methane Wells in the CBM Development Block in Western Guizhou. Earth Science, 44(9): 2862-2873 (in Chinese with English abstract). Li, X. D., Fei, B., Feng, Q. Y., et al., 2018. Effects of Coalbed Methane Co-Produced Water for Irrigation in China's Qinshui Basin: An Experimental Field Study. Mine Water and the Environment, 37(2): 263-271. https://doi.org/10.1007/s10230-018-0536-y Liu, H. H., Sang, S. X., Cao, L. W., et al., 2014. Heavy Metal Pollution Feature Analysis and Potential Ecological Risk Assessment of the Coalbed Methane Production on the Topsoil Qaulity of the Mining Area. Journal of Safety and Environment, 14(3): 288-293 (in Chinese with English abstract). Liu, Y., Ji, Z. Y., Liu, S. J., et al., 2020. Application and Comparison of Three Methods in Water Quality Evaluation of Plateau Lakes. Transactions of Oceanology and Limnology, (2): 166-174 (in Chinese with English abstract). Liu, Y., Zheng, B. H., Fu, Q., et al., 2013. Application of Water Pollution Index in Water Quality Assessment of Rivers. Environmental Monitoring in China, 29(3): 49-55 (in Chinese with English abstract). Majee, U., Chattopadhyay, G. N., Chaudhury, S., 2018. Qualitative Assessment of Coal Bed Methane Produced Water for Developing Safe Disposal Strategies. Environmental Earth Sciences, 77(15): 558. https://doi.org/10.1007/s12665-018-7736-4 Peng, X. Y., Zhou, L. C., Wu, W. H., et al., 2021. Application Analysis of Water Pollution Index Method in Water Quality Evaluation for the Tributary of Xiangjiang River in Changsha City. Sichuan Environment, 40(2): 172-177 (in Chinese with English abstract). Qi, L., Gao, J. F., 2008. Revisiting Platinum Group Elements of Late Permian Coals from Western Guizhou Province, SW China. International Journal of Coal Geology, 75(3): 189-193. https://doi.org/10.1016/j.coal.2008.05.007 Sun, L. R., Rao, W., Liu, W. S., 2022. The Impact Assessment and Study of 226Ra Radioactivity in Shale Gas Flowback Water in the Southern Sichuan Basin. Environmental Impact Assessment, 44(2): 44-48, 53 (in Chinese with English abstract). Tang, H., 2020. Application of Improved Grey Relational Analysis in Groundwater Evaluation. Water Resources & Hydropower of Northeast China, 38(8): 51-53, 72 (in Chinese with English abstract). Wen, C. S., Yu, Z. S., Liu, X. C., et al., 2014. Progress in the Research on the Water Quality Characteristics and Treatment Technologies of Coal Bed Methane Produced Effluent. Industrial Water Treatment, 34(10): 1-6 (in Chinese with English abstract). doi: 10.11894/1005-829x.2014.34(10).001 Wu, C. C., 2019. Geochemical Characteristics and Response of Produced Water from Cbm Wells in Western Guizhou (Dissertation). China University of Mining and Technology, Xuzhou (in Chinese with English abstract). Yang, D. M., Yu, Y. X., Liang, R., et al., 2018. Environment Impact Appraisal (EIA) for Shale Gas Development in China: Present Status, Existing Issues and Proposals. Natural Gas Industry, 38(8): 119-125 (in Chinese with English abstract). Yang, M., Ju, Y. W., Liu, G. J., et al., 2013. Geochemical Characters of Water Coproduced with Coalbed Gas and Shallow Groundwater in Liulin Coalfield of China. Acta Geologica Sinica-English Edition, 87(6): 1690-1700. https://doi.org/10.1111/1755-6724.12169 Yang, Y. Z., 1999. The Geochemistry of Anomalous Elements in the Environment of Guizhou. Guizhou Geology, 16(1): 66-72 (in Chinese with English abstract). Yang, Z. B., Qin, Y., Wu, C. C., et al., 2019. Geochemical Response of Produced Water in the CBM Well Group with Multiple Coal Seams and Its Geological Significance-A Case Study of the Songhe Well Group in Western Guizhou. International Journal of Coal Geology, 207: 39-51. https://doi.org/10.1016/j.coal.2019.03.017 Yang, Z. B., Qin, Z. H., Wang, G. C., et al., 2021. Environmental Effects of Water Product from Coalbed Methane Wells: A Case Study of the Songhe Well Group, Western Guizhou, China. Natural Resources Research, 30(5): 3747-3760. https://doi.org/10.1007/s11053-021-09866-w Yang, Z. B., Zhang, Z. G., Qin, Y., et al., 2018. Optimization Methods of Production Layer Combination for Coalbed Methane Development in Multi-Coal Seams. Petroleum Exploration and Development, 45(2): 312-320. https://doi.org/10.1016/S1876-3804(18)30034-X Zhang, D. Y., Zhu, J., Zhao, X. L., et al., 2018. Dynamic Evaluation and Availability Analysis of Coalbed Methane Resources in China. Journal of China Coal Society, 43(6): 1598-1604 (in Chinese with English abstract). Zhang, Y. H., Guo, R., Hu, R., et al., 2015. Comprehensive Evaluation of Groundwater Quality Based on AHP. Journal of Lanzhou Jiaotong University, 34(6): 17-22 (in Chinese with English abstract). doi: 10.3969/j.issn.1001-4373.2015.06.004 Zhu, J., Lian, X. Z., Ke, A. Y., et al., 2018. Application of Fuzzy Synthetic Evaluation Method in Nanxi River Water Quality Evaluation. Zhejiang Hydrotechnics, 46(6): 8-13, 28 (in Chinese with English abstract). 敖成欢, 钟九生, 赵梦, 等, 2020. 基于模糊综合法和灰色关联法的百花湖水质评价. 水土保持通报, 40(1): 116-122, 129. https://www.cnki.com.cn/Article/CJFDTOTAL-STTB202001017.htm 保金花, 黄勇, 2008. 水质综合评价方法研究综述. 水利科技与经济, 14(8): 639-642. doi: 10.3969/j.issn.1006-7175.2008.08.018 陈佳木, 吴志华, 刘文浩, 等, 2021. 湖南水口山多金属矿区废石堆重金属污染评价及赋存形态分析. 地球科学, 46(11): 4127-4139. doi: 10.3799/dqkx.2021.019 邓聚龙, 1984. 社会经济灰色系统的理论与方法. 中国社会科学, (6): 47-60. https://www.cnki.com.cn/Article/CJFDTOTAL-ZSHK198406005.htm 丁桑岚, 2001. 环境评价概论. 北京: 化学工业出版社, 88. 方红卫, 孙世群, 朱雨龙, 等, 2009. 主成分分析法在水质评价中的应用及分析. 环境科学与管理, 34(12): 152-154. https://www.cnki.com.cn/Article/CJFDTOTAL-BFHJ200912042.htm 江丽, 刘春艳, 王红娟, 等, 2021. 国内外页岩气开发环境管理现状及对比. 天然气工业, 41(12): 146-155. https://www.cnki.com.cn/Article/CJFDTOTAL-TRQG202112016.htm 金军, 杨兆彪, 秦勇, 等, 2022. 贵州省煤层气开发进展、潜力及前景. 煤炭学报, 47(11): 4113-4126. 李清光, 吴攀, 顾尚义, 等, 2019. 黔西某煤层气开发区块产出水有毒有害元素污染特征及其环境效应. 地球科学, 44(9): 2862-2873. doi: 10.3799/dqkx.2019.150 刘会虎, 桑树勋, 曹丽文, 等, 2014. 煤层气生产区重金属污染特征及其潜在生态危害. 安全与环境学报, 14(3): 288-293. https://www.cnki.com.cn/Article/CJFDTOTAL-AQHJ201403065.htm 刘宇, 吉正元, 刘淑娟, 等, 2020. 三种方法在高原湖泊水质评价中的应用与比较. 海洋湖沼通报, (2): 166-174. https://www.cnki.com.cn/Article/CJFDTOTAL-HYFB202002021.htm 刘琰, 郑丙辉, 付青, 等, 2013. 水污染指数法在河流水质评价中的应用研究. 中国环境监测, 29(3): 49-55. https://www.cnki.com.cn/Article/CJFDTOTAL-IAOB201303011.htm 彭小玉, 周理程, 吴文晖, 等, 2021. 水污染指数法在湘江长沙段支流水质评价中的应用分析. 四川环境, 40(2): 172-177. https://www.cnki.com.cn/Article/CJFDTOTAL-SCHJ202102026.htm 孙灵如, 饶维, 刘文士, 2022. 川南页岩气压裂返排液226Ra放射性影响评估与研究. 环境影响评价, 44(2): 44-48, 53. https://www.cnki.com.cn/Article/CJFDTOTAL-SXHS202202009.htm 唐贺, 2020. 改进灰色关联分析法在地下水评价中的应用. 东北水利水电, 38(8): 51-53, 72. https://www.cnki.com.cn/Article/CJFDTOTAL-DBSL202008021.htm 温彩哨, 余志晟, 刘新春, 等, 2014. 煤层气产出水水质特征及处理技术研究进展. 工业水处理, 34(10): 1-6. https://www.cnki.com.cn/Article/CJFDTOTAL-GYSC201410001.htm 吴丛丛, 2019. 贵州西部煤层气井排采水地球化学特征及其响应(硕士学位论文). 徐州: 中国矿业大学. 杨德敏, 喻元秀, 梁睿, 等, 2018. 我国页岩气开发环境影响评价现状、问题及建议. 天然气工业, 38(8): 119-125. https://www.cnki.com.cn/Article/CJFDTOTAL-TRQG201808024.htm 杨永忠, 1999. 贵州环境异常元素地球化学研究. 贵州地质, 16(1): 66-72. https://www.cnki.com.cn/Article/CJFDTOTAL-GZDZ199901011.htm 张道勇, 朱杰, 赵先良, 等, 2018. 全国煤层气资源动态评价与可利用性分析. 煤炭学报, 43(6): 1598-1604. https://www.cnki.com.cn/Article/CJFDTOTAL-MTXB201806012.htm 张耀辉, 郭瑞, 胡蕊, 等, 2015. 基于层次分析法的地下水水质综合评价. 兰州交通大学学报, 34(6): 17-22. https://www.cnki.com.cn/Article/CJFDTOTAL-LZTX201506004.htm 朱洁, 连新泽, 柯爱英, 等, 2018. 模糊评价法在楠溪江水质评价中的应用. 浙江水利科技, 46(6): 8-13, 28. https://www.cnki.com.cn/Article/CJFDTOTAL-JJSL201806003.htm -

 点击查看大图
计量
- 文章访问数: 771
- HTML全文浏览量: 771
- PDF下载量: 52
- 被引次数: 0
