- 中文版:
- EI 100%收录
- 英文版
- SCI 100%收录


中国出版政府奖提名奖
中国百强科技报刊
湖北出版政府奖
中国高校百佳科技期刊
中国最美期刊
中国出版政府奖提名奖
中国百强科技报刊
湖北出版政府奖
中国高校百佳科技期刊
中国最美期刊
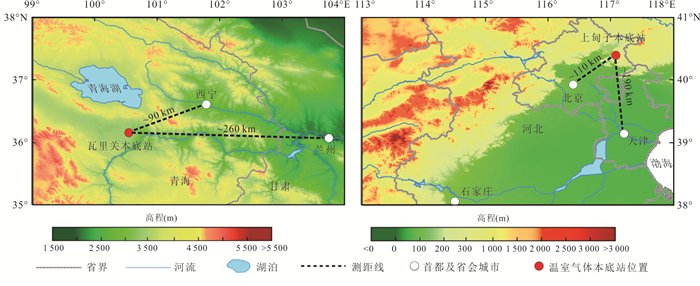
| Citation: | Zhang Lin, Jin Menggui, Liu Yanfeng, Liang Xing, Yang Shiqi, Xian Yang, 2021. Concentration Variation Characteristics of Atmospheric Greenhouse Gases at Waliguan and Shangdianzi in China. Earth Science, 46(8): 2984-2998. doi: 10.3799/dqkx.2020.267

|

|
Barry, R. G., Carleton, A. M., 2001. Synoptic and Dynamic Climatology. Taylor & Francis, London. https://doi.org/10.4324/9780203218181
|
|
Easterling, D. R., Meehl, G. A., Parmesan, C., et al., 2000. Climate Extremes: Observations, Modeling, and Impacts. Science, 289(5487): 2068-2074. https://doi.org/10.1126/science.289.5487.2068
|
|
IPCC, 2013. Climate Change 2013: The Physical Science Basis. In: Stocker, T.F., Qin, D., Plattner, G.K., et al., eds., Contribution of Working Group I to the Fifth Assessment Report of the Intergovernmental Panel on Climate Change. Cambridge University Press, Cambridge.
|
|
Kendall, M.G., 1975. Rank Correlation Methods (4th Edition). Charles Griffin, London.
|
|
Liu, L. X., Zhou, L. X., Vaughn, B., et al., 2014. Background Variations of Atmospheric CO2 and Carbon-Stable Isotopes at Waliguan and Shangdianzi Stations in China. Journal of Geophysical Research: Atmospheres, 119(9): 5602-5612. https://doi.org/10.1002/2013jd019605
|
|
Mann, H. B., 1945. Nonparametric Tests against Trend. Econometrica, 13(3): 245-259. https://doi.org/10.2307/1907187
|
|
Mu, L., Wu, D.X., Zhou, G., et al., 2007. Changes in Atlantic Thermohaline Circulation under Different Atmospheric CO2 Scenarios. Earth Science, 32(1): 141-146 (in Chinese with English abstract).
|
|
National Climate Change Center, China Meteorological Administration, 2019. China Blue Book on Climate Change, 2019. National Climate Change Center, China Meteorological Administration, Beijing (in Chinese).
|
|
NOAA, 2017. Trends in Atmospheric Carbon Dioxide. https://www.esrl.noaa.gov/gmd/ccgg/trends/gr.html
|
|
Oke, T. R., 2002. Boundary Layer Climates. Psychology Press, London. https://doi.org/10.4324/9780203407219
|
|
Pu, W. W., Quan, W. J., Ma, Z. Q., et al., 2017. Long-Term Trend of Chemical Composition of Atmospheric Precipitation at a Regional Background Station in Northern China. Science of The Total Environment, 580: 1340-1350. https://doi.org/10.1016/j.scitotenv.2016.12.097
|
|
Rolph, G., Stein, A., Stunder, B., 2017. Real-Time Environmental Applications and Display System: READY. Environmental Modelling & Software, 95: 210-228. https://doi.org/10.1016/j.envsoft.2017.06.025
|
|
Shang, J., Yang, G., Yu, F.W., 2015. Agricultural Greenhouse Gases Emissions and Influencing Factors in China. Chinese Journal of Eco-Agriculture, 23(3): 354-364 (in Chinese with English abstract). http://en.cnki.com.cn/Article_en/CJFDTOTAL-ZGTN201503012.htm
|
|
Stein, A. F., Draxler, R. R., Rolph, G. D., et al., 2015. NOAA's HYSPLIT Atmospheric Transport and Dispersion Modeling System. Bulletin of the American Meteorological Society, 96(12): 2059-2077. https://doi.org/10.1175/bams-d-14-00110.1
|
|
Stępalska, D., Myszkowska, D., Piotrowicz, K., et al., 2020. High Ambrosia Pollen Concentrations in Poland Respecting the Long Distance Transport (LDT). Science of The total Environment, 736: 139615. https://doi.org/10.1016/j.scitotenv.2020.139615
|
|
Wang, J. X., Rothausen, S. G. S. A., Conway, D., et al., 2012. China's Water-Energy Nexus: Greenhouse-Gas Emissions from Groundwater Use for Agriculture. Environmental Research Letters, 7(1): 014035. https://doi.org/10.1088/1748-9326/7/1/014035
|
|
Wang, Y. S., Zhou, L., Wang, M. X., et al., 2001. Trends of Atmospheric Methane in Beijing. Chemosphere-Global Change Science, 3(1): 65-71. https://doi.org/10.1016/s1465-9972(00)00022-2
|
|
Wei, F. Y., 2007. Modern Climate Statistical Diagnosis and Prediction Technology. China Meteorological Press, Beijing (in Chinese).
|
|
WMO, 2019. Greenhouse Gas Bulletin (GHG Bulletin): The State of Greenhouse Gases in the Atmosphere Based on Global Observations through 2018. https://library.wmo.int/doc_num.php?explnum_id=10100, 2019-11-25
|
|
Xia, L.J., Zhou, L.X., Liu, L.X., et al., 2016. Monitoring Atmospheric CO2 and δ13C (CO2) Background Levels at Shangdianzi Station in Beijing, China. Environmental Science, 37(4): 1248-1255 (in Chinese with English abstract). http://www.researchgate.net/publication/304935113_Monitoring_atmospheric_CO2_and_d13CCO2_background_levels_at_Shangdianzi_station_in_Beijing_China
|
|
Xing, Z.X., Yan, D.D., Liu, M.X., et al., 2015. Spatiotemporal Variability Analysis of Annual Precipitation in Sanjiang Plain in Recent Sixty Years. Transactions of the Chinese Society for Agricultural Machinery, 46(11): 337-344 (in Chinese with English abstract). http://www.cnki.com.cn/Article/CJFDTotal-NYJX201511046.htm
|
|
Yang, Q., Guan, L., Tao, F., et al., 2018. Changes of CH4 Concentrations Obtained by Ground-Based Observations at Five Atmospheric Background Stations in China. Environmental Science & Technology, 41(6): 1-7 (in Chinese with English abstract).
|
|
Zhang, D. Q., Tang, J., Shi, G. Y., et al., 2008. Temporal and Spatial Variations of the Atmospheric CO2 Concentration in China. Geophysical Research Letters, 35(3): L03801. https://doi.org/10.1029/2007gl032531
|
|
Zhang, F., Zhou, L. X., Xu, L., 2013. Temporal Variation of Atmospheric CH4 and the Potential Source Regions at Waliguan, China. Scientia Sinica Terrae, 43(4): 536-546 (in Chinese). doi: 10.1360/zd-2013-43-4-536
|
|
Zhang, X., Jiang, H., 2014. Spatial Variations in Methane Emissions from Natural Wetlands in China. International Journal of Environmental Science and Technology, 11: 77-86. https://doi.org/10.1007/s13762-013-0385-y
|
|
Zhou, C., Shi, R.H., Gao, W., 2015. Comparison of Carbon Dioxide in Mid-Troposphere and Near-Surface. Journal of Geo-Information Science, 17(11): 1286-1293 (in Chinese with English abstract).
|
|
Zhou, C., Shi, R. H., Liu, C. S., et al., 2013. A Correlation Analysis of Monthly Mean CO2 Retrieved from the Atmospheric Infrared Sounder with Surface Station Measurements. International Journal of Remote Sensing, 34(24): 8710-8723. https://doi.org/10.1080/01431161.2013.847295
|
|
Zhou, L. X., White, J. W. C., Conway, T. J., et al., 2006. Long-Term Record of Atmospheric CO2 and Stable Isotopic Ratios at Waliguan Observatory: Seasonally Averaged 1991-2002 Source/Sink Signals, and a Comparison of 1998-2002 Record to the 11 Selected Sites in the Northern Hemisphere. Global Biogeochemical Cycles, 20(2): GB2001. https://doi.org/10.1029/2004gb002431
|
|
Zhou, L.X., Zhou, X.J., Zhang, X.C., et al., 2007. Progress in the Study of Background Greenhouse Gases at Waliguan Observatory. Acta Meteorologica Sinica, 65(3): 458-468 (in Chinese with English abstract). http://en.cnki.com.cn/Article_en/CJFDTOTAL-QXXB200703013.htm
|
|
牟林, 吴德星, 周刚, 等, 2007. 温室气体浓度增加情景下大西洋温盐环流的演变. 地球科学, 32(1): 141-146. http://www.earth-science.net/article/id/1677
|
|
尚杰, 杨果, 于法稳, 2015. 中国农业温室气体排放量测算及影响因素研究. 中国生态农业学报, 23(3): 354-364. https://www.cnki.com.cn/Article/CJFDTOTAL-ZGTN201503012.htm
|
|
魏风英, 2007. 现代气候统计诊断与预测技术. 北京: 气象出版社.
|
|
夏玲君, 周凌晞, 刘立新, 等, 2016. 北京上甸子站大气CO2及δ13C(CO2)本底变化. 环境科学, 37(4): 1248-1255. https://www.cnki.com.cn/Article/CJFDTOTAL-HJKZ201604009.htm
|
|
邢贞相, 闫丹丹, 刘美鑫, 等, 2015. 三江平原近60年降水量时空变异特征分析. 农业机械学报, 46(11): 337-344. doi: 10.6041/j.issn.1000-1298.2015.11.046
|
|
杨倩, 官莉, 陶法, 等, 2018. 中国5个大气本底站观测的CH4浓度变化规律. 环境科学与技术, 41(6): 1-7. https://www.cnki.com.cn/Article/CJFDTOTAL-FJKS201806001.htm
|
|
张芳, 周凌晞, 许林, 2013. 瓦里关大气CH4浓度变化及其潜在源区分析. 中国科学: 地球科学, 43(4): 536-546. https://www.cnki.com.cn/Article/CJFDTOTAL-JDXK201304005.htm
|
|
中国气象局国家气候变化中心, 2019. 中国气候变化蓝皮书(2019). 北京: 中国气象局国家气候变化中心.
|
|
周聪, 施润和, 高炜, 2015. 对流层中层与近地面大气二氧化碳浓度的比较研究. 地球信息科学学报, 17(11): 1286-1293. https://www.cnki.com.cn/Article/CJFDTOTAL-DQXX201511004.htm
|
|
周凌晞, 周秀骥, 张晓春, 等, 2007. 瓦里关温室气体本底研究的主要进展. 气象学报, 65(3): 458-468. doi: 10.3321/j.issn:0577-6619.2007.03.014
|
Figures(9) / Tables(2)

 DownLoad: