


Floating Rate and Sea Surface Outlet Point of Ocean Bottom Seismometer
-
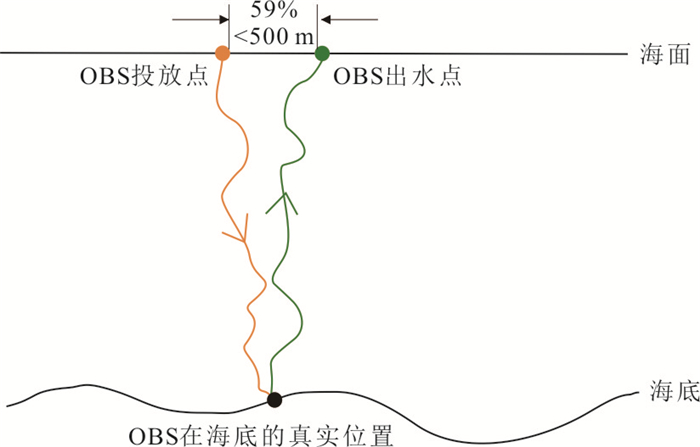
摘要: 使用海底地震仪(OBS)对极地浮冰区进行探测时,存在上浮的OBS被浮冰遮挡而难以发现和回收等困难,为提高两极浮冰区海底地震探测效率,亟需对OBS上浮出水时间和位置进行较为准确地预测.本研究以2019年南海OBS观测、2020年西太平洋OBS探测以及2011年南海东部次海盆三维OBS探测现场作业的实测距离和位置信息等数据为基础,分析了OBS上浮速率、投放点和出水点的特征,开展了OBS在水中下沉和上浮的运动过程研究,总结了OBS出水点的分布规律.结果表明:(1)在垂直方向上,OBS上浮速率近似匀速,可用平均速率代替,进而可精确计算上浮出水时间;(2)OBS在海底的位置与投放位置的偏移距随机分布,这表明投放点水深与重定位偏移距离无明显线性相关性;(3)OBS上浮出水点与投放点有重合的趋势,两者距离在300 m以内的概率大于31%,两者距离在500 m以内的概率大于59%.Abstract: Ocean bottom seismometer (OBS) active and passive experiments are the most useful methods to reveal crustal and upper mantle structures under the ocean, but till now, few OBS experiments have been done in the Arctic and Antarctica, where the main challenges are finding and recovering the OBSs sheltered by the high coverage rate of floating ices. For the forthcoming OBS experiments in the polar regions, it is necessary to study the time and the location of OBS surfacing to the sea (outlet position). To reveal the process of OBS sinking and floating in the sea and to find the law of OBS's outlet position, we use the information of the up-floating rate, deployment position and recovery position of OBS during three expeditions of the 2019 South China Sea OBS observation, 2020 Western Pacific OBS experiment and 2011 the South China Sea three-dimension OBS experiment in this study. The main results are as follows: (1) The OBS shows stable up-floating rate in the vertical direction, which will be helpful to predict the moment of OBS surfacing to the sea; (2) the OBS locations on the sea bottom are randomly distributed with the offset of the drop location, which indicates that the water depth at the drop point has no obvious linear correlation with the relocation offset distance; (3) the outlet position and deployment position of OBS suggest very close distance, with a statistical estimate of < 300 meters (31%) and < 500 meters (59%).
-
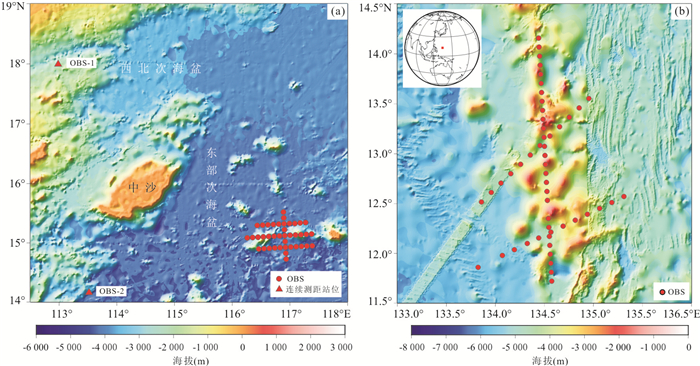
图 1 OBS试验区域位置分布
水深资料来源于GEBCO(https://www.bodc.ac.uk/projects/data_management/international/gebco/). a. 2011年南海东部次海盆三维OBS探测区域与站位分布(红色圆点据张莉等(2013))与2019年南海OBS观测试验连续测距站位分布(红色三角);b. 2020年西太平洋OBS探测区域与站位分布(红色圆点),左上角插图中红色方块为试验区在全球的位置
Fig. 1. Location distribution of OBS experiment
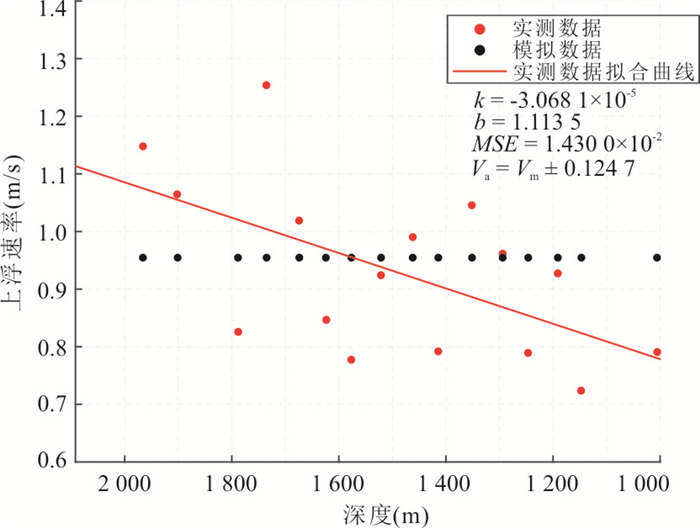
图 3 OBS-1上浮速率实测数据与模拟结果对比
其中实测数据拟合为线性拟合,拟合后的斜率(k)、截距(b)、均方误差(MSE)如右上所示,均方误差越小,说明拟合结果越好
Fig. 3. Comparison of measured and simulated up-floating rates of OBS-1
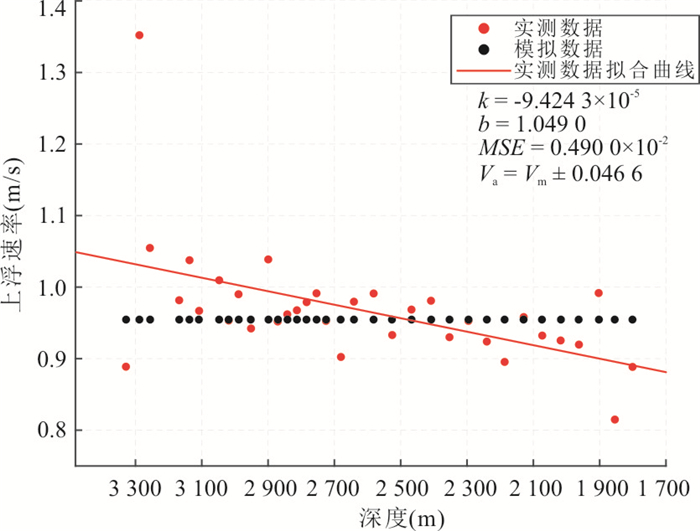
图 4 OBS-2上浮速率实测数据与模拟结果对比
Fig. 4. Comparison of measured and simulated up-floating rates of OBS-2
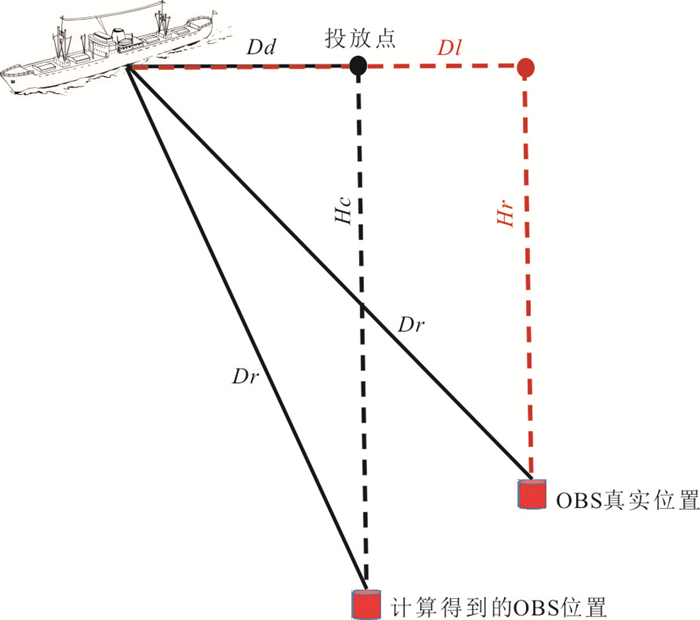
图 5 利用勾股定理计算OBS深度时的误差来源
Dr.实测距离;Dd.船漂离投放点距离;Hc.计算所得OBS深度;Dl.声学换能器与OBS的水平距离;Hr.OBS实际深度
Fig. 5. Error sources when using Pythagorean theorem to calculate OBS's depth
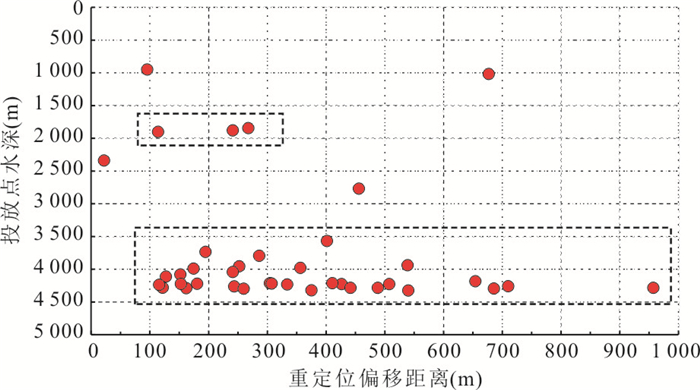
图 6 OBS投放点水深与重定位偏移距离关系
数据来自2011年南海东部次海盆三维OBS探测试验(张莉等,2013),其中黑色虚线框内显示为投放点水深分别为2 000 m和4 000 m左右的OBS
Fig. 6. Relationship between the water depth at OBS deployment position and the offset of the relocated OBS position and deployment position
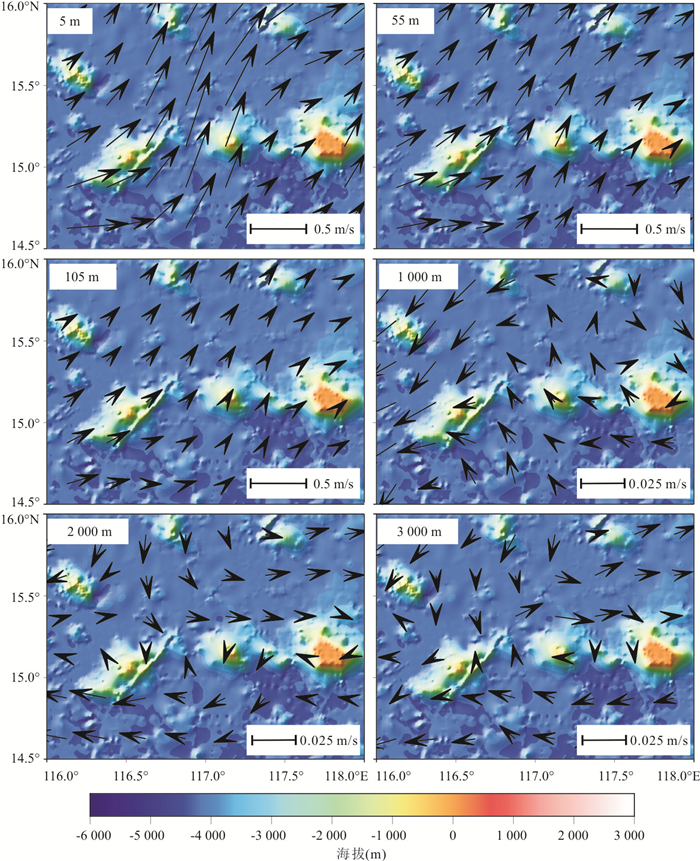
图 7 2011年南海东部次海盆三维OBS探测试验区不同水深的海流速度场分布
图中箭头方向代表海流的方向,箭头长度代表海流的流速大小;数据来源:http://apdrc.soest.hawaii.edu/erddap/griddap/hawaii_soest_628b_fb2e_515b.html
Fig. 7. Current conditions at different depths in the location 2011 South China Sea
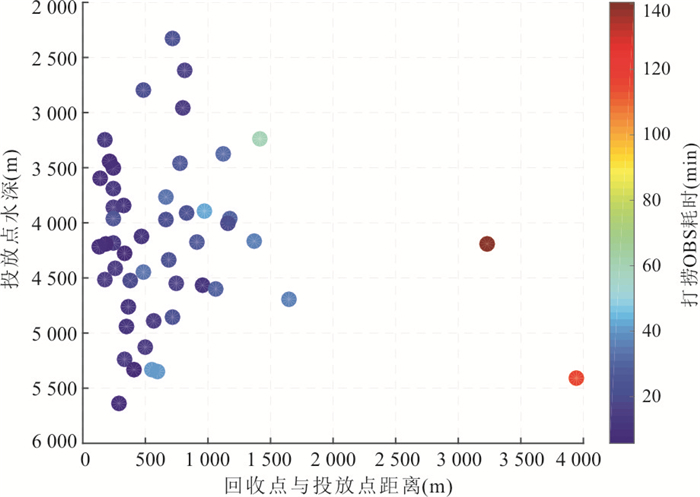
图 8 OBS投放点水深与回收点偏离投放点距离关系
Fig. 8. Relationship between the water depth of OBS at deployment position and the distance between the recovery position from the deployment position
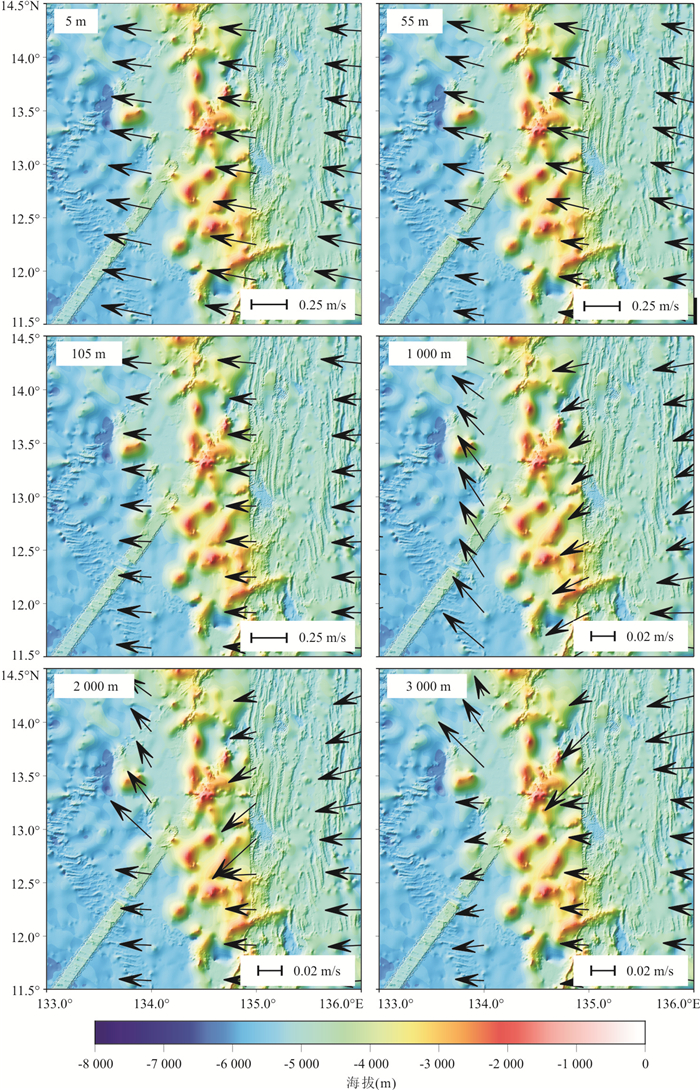
图 9 2020年西太平洋OBS探测区域不同水深的海流速度场分布
图中箭头方向代表海流的方向,箭头长度代表海流的流速大小;数据来源:http://apdrc.soest.hawaii.edu/erddap/search/index.html?page=1&itemsPerPage=1000&searchFor=GODAS
Fig. 9. Current conditions at different depths in the location of the 2020 Western Pacific OBS experiment
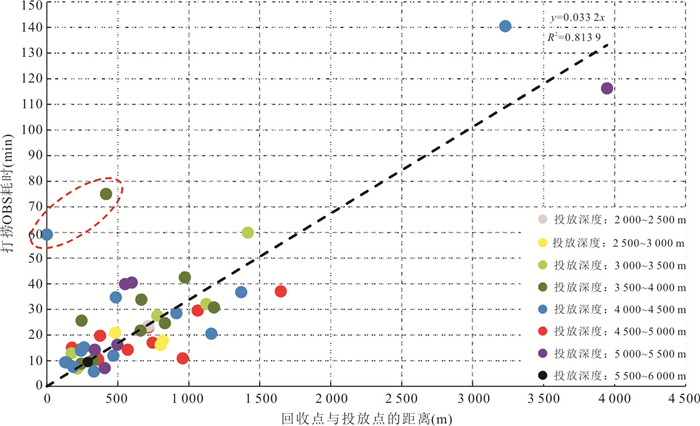
图 10 打捞OBS耗时‒回收点与投放点距离关系
黑色虚线为线性拟合所得的趋势线,线性拟合所得的方程在右上角,R2为相关系数(R2=1为最优拟合结果),红色椭圆虚线内为拟合时剔除的点
Fig. 10. Relationship between OBS's recovery time and distance between the recovery position and the deployment position
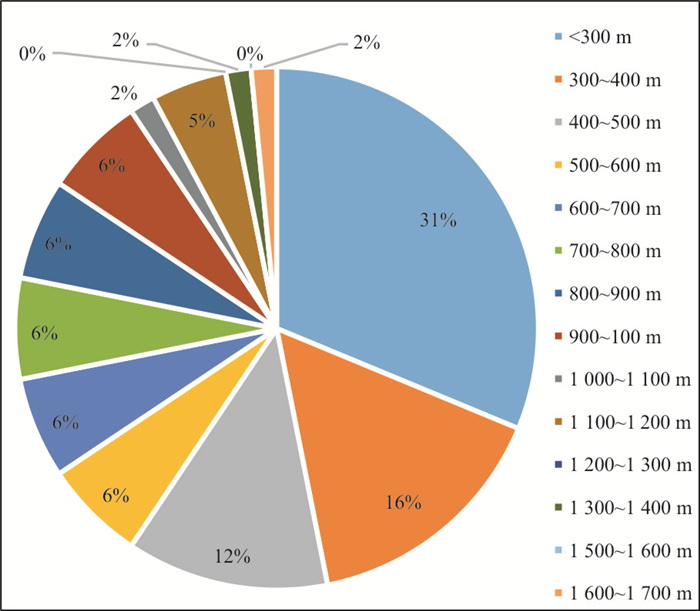
图 12 2019年南海和2020年西太平洋试验中64台OBS回收点偏离投放点距离的分布
不同颜色代表不同距离,扇形面积的大小代表该距离范围内OBS台数,例如,31%代表 64台OBS中有20台(64×31%)OBS投放点和回收点距离小于300 m
Fig. 12. Pie chart shows distances between the recovery positions and the deployment positions of 64 OBSs used in the 2020 South China Sea and Western Pacific OBS experiments
表 1 OBS-1上浮过程轨迹信息
Table 1. Trajectory information of the process of floating of OBS-1
*实测距离(m) 船漂离投放点距离(m) 计算所得OBS深度(m) 两次测量时间间隔(s) 上浮速率(m/s) 2 091 402 2 052 / / 2 028 498 1 966 75 1.15 1 970 513 1 902 60 1.06 1 869 544 1 788 138 0.83 1 822 555 1 735 42 1.25 1 768 568 1 674 60 1.02 1 726 586 1 623 60 0.85 1 685 594 1 577 60 0.78 1 638 607 1 521 60 0.92 1 588 620 1 462 60 0.99 1 548 629 1 414 60 0.79 1 496 641 1 352 60 1.05 1 449 652 1 294 60 0.96 1 412 663 1 247 60 0.79 1 369 675 1 191 60 0.93 1 337 686 1 148 60 0.72 1 240 726 1 005 180 0.79  下载: 导出CSV
表 2 OBS-2上浮过程轨迹信息
Table 2. Trajectory information of the process of floating of OBS-2
*实测距离(m) 船漂离投放点距离(m) 计算所得OBS深度(m) 两次测量时间间隔(s) 上浮速率(m/s) 3 369 209 3 363 / / 3 336 220 3 329 38 0.89 3 296 227 3 288 30 1.35 3 265 235 3 257 30 1.05 3 179 262 3 168 90 0.98 3 149 274 3 137 30 1.04 3 121 284 3 108 30 0.97 3 063 308 3 047 60 1.01 3 036 322 3 019 30 0.95 3 008 336 2 989 30 0.99 2 973 357 2 951 40 0.94 2 925 385 2 900 50 1.04 2 899 402 2 871 30 0.95 2 873 420 2 842 30 0.96 2 847 438 2 813 30 0.97 2 821 457 2 784 30 0.98 2 795 477 2 754 30 0.99 2 770 495 2 725 30 0.95 2 732 529 2 680 50 0.90 2 699 556 2 641 40 0.98 2 650 598 2 582 60 0.99 2 605 638 2 526 60 0.93 2 559 678 2 468 60 0.97 2 514 720 2 409 60 0.98 2 473 664 2 353 60 0.93 2 432 608 2 296 60 0.95 2 394 552 2 240 60 0.92 2 359 496 2 187 60 0.90 2 322 440 2 129 60 0.96 2 288 968 2 073 60 0.93 2 256 912 2 018 60 0.93 2 226 856 1 962 60 0.92 2 194 800 1 903 60 0.99 2 173 744 1 854 60 0.81 2 150 688 1 801 60 0.89 注:该数据来自2019年南海被动源OBS观测试验.*实测距离(Dr):声学换能器与OBS之间的直线距离(斜距);船漂离投放点距离(Dd):由于无法确定声学换能器与OBS的水平距离,因此这里使用船漂离投放点距离来进行近似表示;计算所得OBS深度(Hc):Hc=$\sqrt {D{r^2} - D{d^2}} $,结果保留整数;上浮速率(v):v=(Hc2-Hc1)/(t2-t1),并以此速率近似该深度的瞬时速率,结果保留两位小数;在实际作业中计算上浮速率的目的是预测OBS上浮出水时间,从而指导OBS的回收.
下载: 导出CSV
表 3 参数信息
Table 3. Parameter information
M (kg) VOBS (m3) ρOBS (kg/m3) *ρocean *R′(s-1) 44 0.097 453.6 ${\rho _0}\left({1 + \frac{{{N^2}}}{g}\left| z \right|} \right)$ 13 注:ρ0为海水某深度的初始密度,根据相关温度、盐度数据本文对海水进行了简要分层(数据来源:https://www.ncei.noaa.gov/access/world-ocean-atlas-2018/);N:布伦特-韦伊塞莱频率,可以根据海水的温度、盐度得到(计算网站:https://www.mt-oceanography.info/Utilities/bvf.html);z:海水深度;R′:与仪器的材料,形状等有关,根据厂家提供该型号的OBS在水中净浮力为30 N左右推算得到;海水分层情况如 表 4 和表 5 所示.
下载: 导出CSV
表 4 OBS-1站位的海水分层情况
Table 4. Seawater stratification at OBS-1 station
z (m) ρ0 (kg/m3) N2(10-8s-2) 0~50 1 021.580 2.082 2 50~150 1 022.578 2.082 2 150~700 1 025.110 2.099 6 700~1 000 1 027.063 0.184 9 1 000~4 000 1 027.381 0.184 9
下载: 导出CSV
表 5 OBS-2站位的海水分层情况
Table 5. Seawater stratification at OBS-2 station
z (m) ρ0 (kg/m3) N2(10-8s-2) 0~50 1 021.130 2.496 4 50~150 1 022.356 2.496 4 150~700 1 025.270 2.405 6 700~1 000 1 027.075 0.173 9 1 000~4 000 1 027.383 0.173 9
下载: 导出CSV
-
Ao, W., Zhao, M. H., Qiu, X. L., et al., 2010. The Correction of Shot and OBS Position in the 3D Seismic Experiment of the SW Indian Ocean Ridge. Chinese Journal of Geophysics, 53(12): 2982-2991 (in Chinese with English abstract). http://d.wanfangdata.com.cn/Periodical/dqwlxb201012022 Caress, D. W., McNutt, M. K., Detrick, R. S., et al., 1995. Seismic Imaging of Hotspot-Related Crustal Underplating Beneath the Marquesas Islands. Nature, 373(6515): 600-603. https://doi.org/10.1038/373600a0 Feng, S.Z., Li, F.Q., Li, S.J., 1999. Introduction to Marine Science. Higher Education Press, Beijing (in Chinese). Hu, J. F., Xu, H. N., Qiu, X. L., et al., 2012. Design of Gun Controlling Chronometer and Its Application in Gathering and Processing OBS Data. Journal of Tropical Oceanography, 31(3): 97-102 (in Chinese with English abstract). http://en.cnki.com.cn/Article_en/CJFDTOTAL-RDHY201203014.htm Kaempf, J., 2009. Ocean Modelling for Beginners, Second Edition. Springer, Berlin. Kong, F. S., Gao, S. S., Liu, K. H., et al., 2020. Seismic Anisotropy and Mantle Flow in the Sumatra Subduction Zone Constrained by Shear Wave Splitting and Receiver Function Analyses. Geochemistry, Geophysics, Geosystems, 21(2): e2019GC008766. https://doi.org/10.1029/2019GC008766 Li, Y. H., Huang, H. B., Qiu, X. L., et al., 2020. Wide-Angle and Multi-Channel Seismic Surveys in Zhongsha Waters. Chinese Journal of Geophysics, 63(4): 1523-1537 (in Chinese with English abstract). Niu, X. W., 2014. Wide Angle Seismic Tomography (2D/3D) of Southwest Indian Ridge (Dissertation). Zhejiang University, Hangzhou (in Chinese with English abstract). Niu, X.W., Gao, J. Y., Wu, Z. C., et al., 2016. Lithosphere Anisotropy of Prydz Bay, Antarctica: From Ocean Bottom Seismometer Long Term OBServation. Earth Science, 41(11): 1950-1958 (in Chinese with English abstract). http://en.cnki.com.cn/Article_en/CJFDTOTAL-DQKX201611010.htm Niu, X. W., Ruan, A. G., Wu, Z. L., et al., 2014. Progress on Practical Skills of Ocean Bottom Seismometer(OBS) Experiment. Progress in Geophysics, 29(3): 1418-1425 (in Chinese with English abstract). Qiu, X. L., Shi, X. B., Yan, P., et al., 2003. Recent Progress of Deep Seismic Experiments and Studies of Crustal Structure in Northern South China Sea. Progress in Natural Science, 13(3): 231-236 (in Chinese with English abstract). Ruan, A. G., Li, J. B., Feng, Z. Y., et al., 2004. Ocean Bottom Seismometer and Its Development in the World. Donghai Marine Science, 22(2): 19-27 (in Chinese with English abstract). http://en.cnki.com.cn/Article_en/CJFDTOTAL-DHHY200402004.htm Xia, C. L., 2009. A Study on Privotal Data Processing Procedure of Ocean Bottom Seismograph (Dissertation). China University of Geoscience, Beijing (in Chinese with English abstract). Xia, S. H., Ao, W., Zhao, M. H., et al., 2011. Corrections and Analysis of Wide Angle Seismic Data from the Sea. Marine Science Bulletin, 30(5): 487-491 (in Chinese with English abstract). http://en.cnki.com.cn/Article_en/ http://search.cnki.net/down/default.aspx?filename=HUTB201105003&dbcode=CJFD&year=2011&dflag=pdfdown Zhang, L., Zhao, M. H., Wang, J., et al., 2013. Correction of OBS Position and Recent Advances of 3D Seismic Exploration in the Central Sub-Basin of South China Sea. Earth Science, 38(1): 33-42 (in Chinese with English abstract). http://en.cnki.com.cn/Article_en/CJFDTOTAL-DQKX201301008.htm Zhao, M. H., Du, F., Wang, Q., et al., 2018. Current Status and Challenges for Three-Dimensional Deep Seismic Survey in the South China Sea. Earth Science, 43(10): 3749-3761 (in Chinese with English abstract). http://en.cnki.com.cn/Article_en/CJFDTotal-DQKX201810034.htm Zhao, M. H., Qiu, X. L., Xia, S. H., et al., 2010. Seismic Structure in the Northeastern South China Sea: S-Wave Velocity and Vp/Vs Ratios Derived from Three-Component OBS Data. Tectonophysics, 480(1-4): 183-197. https://doi.org/10.1016/j.tecto.2009.10.004 Zhu, J. J., Li, S. Z., Lu, J. A., et al., 2020. Scientific Implications and Preliminary Surveying Results of Geological and Physical Oceanography Environment in the Shenhu Area of the Northern South China Sea. Earth Science, 45(4): 1416-1426 (in Chinese with English abstract). 敖威, 赵明辉, 丘学林, 等, 2010. 西南印度洋中脊三维地震探测中炮点与海底地震仪的位置校正. 地球物理学报, 53(12): 2982-2991. doi: 10.3969/j.issn.0001-5733.2010.12.022 冯士筰, 李凤歧, 李少菁, 1999. 海洋科学导论. 北京: 高等教育出版社. 胡家赋, 徐华宁, 丘学林, 等, 2012. 精密枪控计时器设计及在海底数据采集中的应用. 热带海洋学报, 31(3): 97-102. https://www.cnki.com.cn/Article/CJFDTOTAL-RDHY201203014.htm 黎雨晗, 黄海波, 丘学林, 等, 2020. 中沙海域的广角与多道地震探测. 地球物理学报, 63(4): 1523-1537. https://www.cnki.com.cn/Article/CJFDTOTAL-DQWX202004021.htm 牛雄伟, 2014. 西南印度洋中脊2D/3D广角地震层析成像(博士学位论文). 杭州: 浙江大学. 牛雄伟, 高金耀, 吴招才, 等, 2016. 南极洲普里兹湾岩石圈各向异性: 海底地震仪观测. 地球科学, 41(11): 1950-1958. doi: 10.3799/dqkx.2016.135 牛雄伟, 阮爱国, 吴振利, 等, 2014. 海底地震仪实用技术探讨. 地球物理学进展, 29(3): 1418-1425. https://www.cnki.com.cn/Article/CJFDTOTAL-DQWJ201403058.htm 丘学林, 施小斌, 阎贫, 等, 2003. 南海北部地壳结构的深地震探测和研究新进展. 自然科学进展, 13(3): 231-236. doi: 10.3321/j.issn:1002-008X.2003.03.002 阮爱国, 李家彪, 冯占英, 等, 2004. 海底地震仪及其国内外发展现状. 东海海洋, 22(2): 19-27. doi: 10.3969/j.issn.1001-909X.2004.02.004 夏常亮, 2009. OBS地震数据关键处理环节研究(硕士学位论文). 北京: 中国地质大学. 夏少红, 敖威, 赵明辉, 等, 2011. 海洋广角地震数据校正方法探讨. 海洋通报, 30(5): 487-491. doi: 10.3969/j.issn.1001-6392.2011.05.002 张莉, 赵明辉, 王建, 等, 2013. 南海中央次海盆OBS位置校正及三维地震探测新进展. 地球科学, 38(1): 33-42. doi: 10.3799/dqkx.2013.004 赵明辉, 杜峰, 王强, 等, 2018. 南海海底地震仪三维深地震探测的进展及挑战. 地球科学, 43(10): 3749-3761. doi: 10.3799/dqkx.2018.573 朱俊江, 李三忠, 陆敬安, 等, 2020. 南海北部神狐海域地质环境综合调查及科学意义. 地球科学, 45(4): 1416-1426. doi: 10.3799/dqkx.2019.109 -

 点击查看大图
计量
- 文章访问数: 1927
- HTML全文浏览量: 999
- PDF下载量: 63
- 被引次数: 0
