




Evaluation of CMIP6 GCMs Simulation Performance Using a Hashing Algorithm and Its Application to Future Precipitation Projections
-
摘要:
气候变化导致流域极端水文事件频发,评估CMIP6气候模式(global climate models,GCMs)对降水的模拟能力并预测其未来变化趋势对水文研究至关重要.基于1976—2000年18个GCM及卢氏流域9个站点逐日降水数据,引入考虑时空相关性的改进哈希算法(improved Hashing algorithm,ISHA)优选GCMs,突破传统SHA固定网格划分局限,结合非参数分位数映射法(quantile mapping,QM)误差订正,预测2025—2100年4种SSP情景下降水变化. CNRM-CM6-1-HR、FIO-ESM-2-0、INM-CM5-0和NorESM2-MM表现最优;订正后最大月降水和多年平均降水偏差率由9.09%~16.04%、10.41%~23.12%降至0.27%~2.34%、0.48%~1.89%;未来年均降水相对变化幅度随排放情景升高而增大,在低排放情景下波动为-7.71%~10.50%,而在高排放情景下可达-1.89%~18.02%.本世纪中末期或面临降水增加风险,水资源调控与防洪减灾压力加剧.
Abstract:Climate change has led to an increased frequency of extreme hydrological events at the watershed scale. Evaluating the capability of CMIP6 global climate models (GCMs) to simulate precipitation and projecting future precipitation trends are essential for understanding future hydrological characteristics. Based on daily precipitation from 18 GCMs and 9 meteorological stations in the Lushi Basin during 1976—2000, an improved Hashing algorithm (ISHA) incorporating a spatiotemporal correlation mechanism was developed to select optimal GCMs, overcoming the limitation of fixed-grid partitioning in the traditional SHA. Non-parametric quantile mapping (QM) was then applied for bias correction. Based on the selected models, precipitation changes during 2025—2100 were projected under four SSP scenarios. The CNRM-CM6-1-HR, FIO-ESM-2-0, INM-CM5-0, and NorESM2-MM showed the best overall performance. The maximum monthly and long-term mean precipitation bias decreasing from 9.09%-16.04% and 10.41%-23.12% to 0.27%-2.34% and 0.48%-1.89%, respectively. The relative change in future annual precipitation increases with emission scenarios, ranging from -7.71% to 10.50% under low-emission conditions and expanding to -1.89% to 18.02% under high-emission scenarios. The basin may face an increasing risk of enhanced precipitation during the mid-to-late 21st century, thereby intensifying challenges in water resources management and flood control.
-
Key words:
- CMIP6 /
- global climate models (GCMs) /
- Hash algorithm /
- quantile mapping /
- future precipitation /
- hydrogeology
-
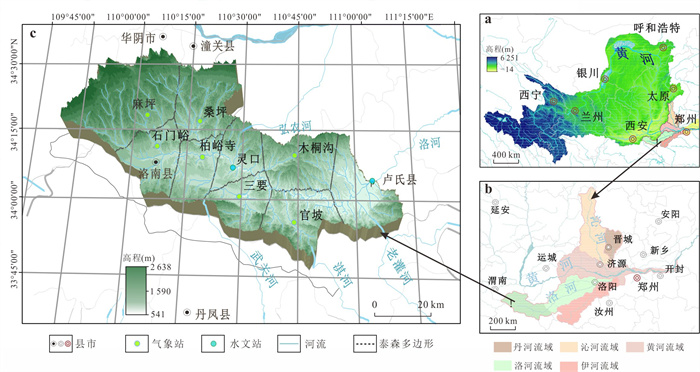
图 1 黄河流域在中国地理位置(a);三花间(黄河三门峡至花园口)在黄河流域地理位置(b);卢氏流域三维地形地貌、河流系统及水文气象站点分布(c)
Fig. 1. Location of the Yellow River Basin in China (a), location of the Sanhuajian in the Yellow River Basin (b), three-dimensional geomorphic types, distribution of river systems, as well locations of hydrological and meteorological stations in the Lushi Basin (c)
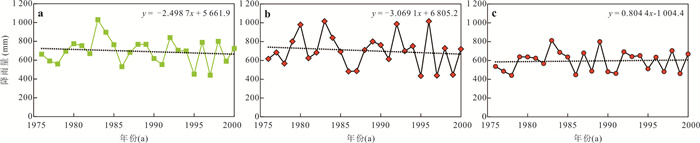
图 2 流域面平均降水量(a); 灵口站年均降水量(b); 卢氏站年均降水量(c)
Fig. 2. Basin-averaged precipitation (a), annual mean precipitation at Lingkou station (b), annual mean precipitation at Lushi station (c)
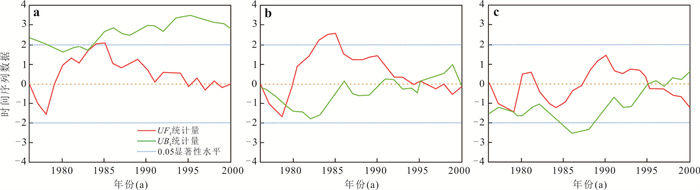
图 3 流域面平均降水量突变点分析(a); 灵口降水量突变点分析(b); 卢氏降水量突变点分析(c)
Fig. 3. Abrupt change point analysis in basin-averaged precipitation (a), abrupt change point analysis at Lingkou station (b), abrupt change point analysis at Lushi station (c)
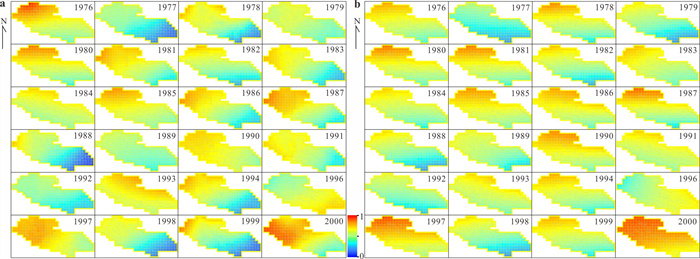
图 4 历史观测与GCM模拟降水时空变化趋势
a.历史观测;b.GCM模拟;图中数字为年份
Fig. 4. Spatio-temporal variations in precipitation utilizing
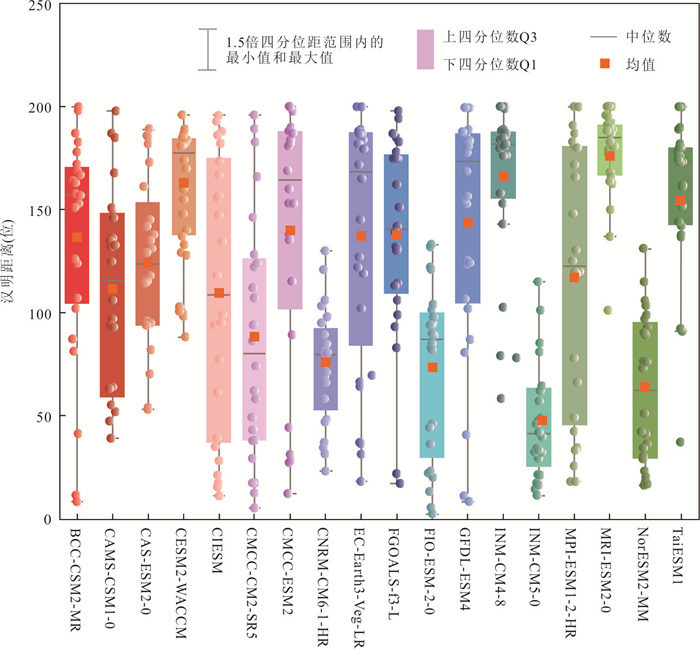
图 6 GCMs模拟降水统计指标(极值、中位数、均值、上/下四分位数)箱线图
Fig. 6. Boxplots of statistical indicators (extrema, median, mean, upper/lower quartile) of precipitation in GCMs
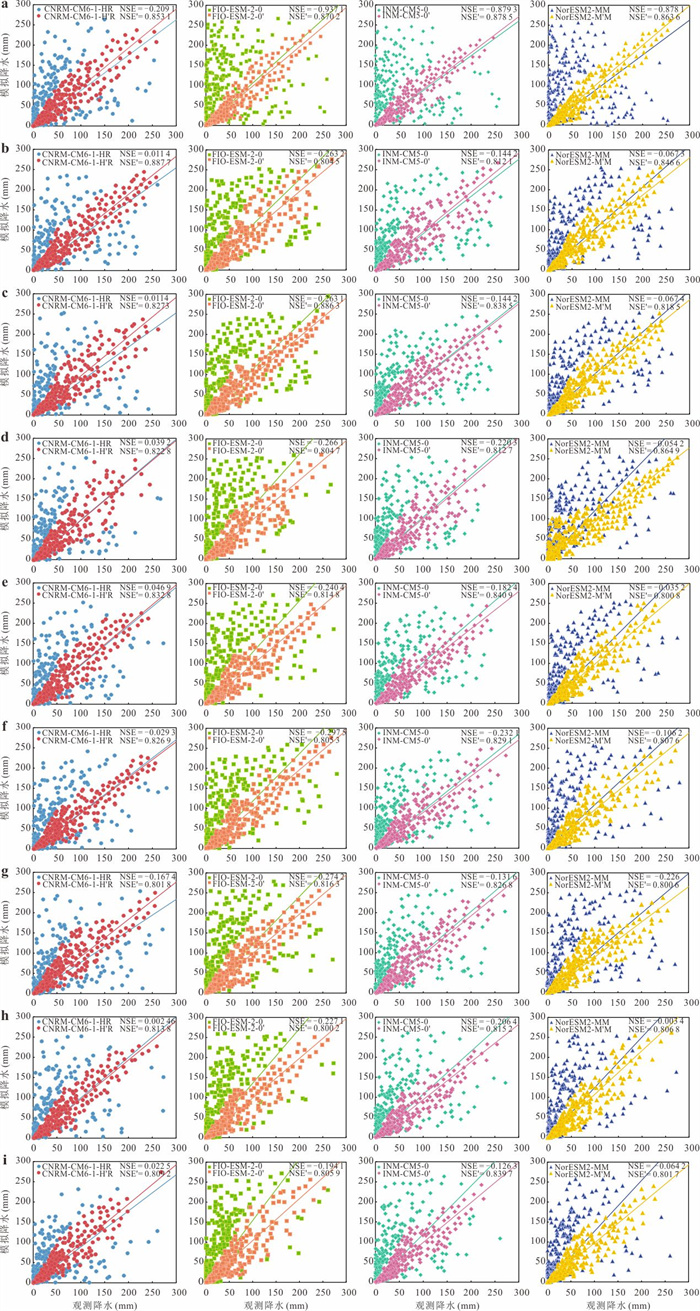
图 7 优选GCMs模拟降水QM误差订正前后月降水变化散点图
右上角标注表示QM误差订正后数据集:a.三要;b.麻坪;c. 石门峪;d.桑坪;e.柏峪寺;f.灵口;g.官坡;h.木桐沟;i.卢氏
Fig. 7. Scatter plots of raw and corrected monthly precipitation for the selected GCMs
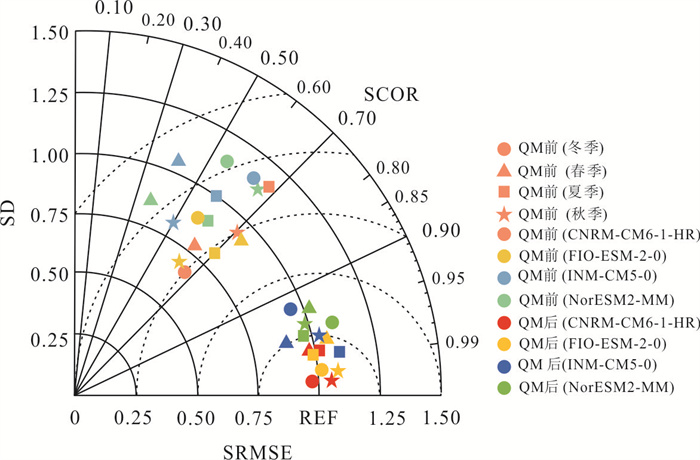
图 8 优选GCMs模拟降水QM误差订正前后季节性变化泰勒图
Fig. 8. Taylor diagram depict comparisons of raw and corrected seasonal precipitation between observations and selected GCMs
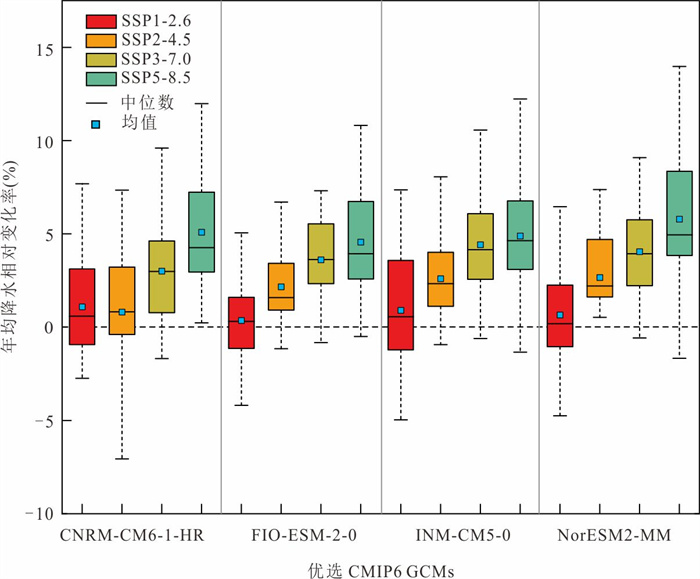
图 9 优选GCMs在不同SSP情景下年均降水相对变化率(Q)箱线图
黑色实线表示中位数;蓝色方块表示均值;符号颜色表示SSPs下优选GCMs分类
Fig. 9. Relative changes in annual average precipitation of selected GCMs under SSPs
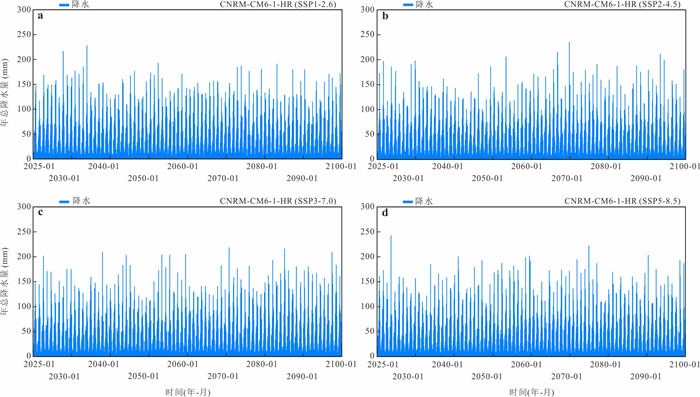
图 10 CNRM-CM6-1-HR模式不同SSP情景下长期降水预测
Fig. 10. Long-term precipitation projections by the CNRM-CM6-1-HR model under SSPs
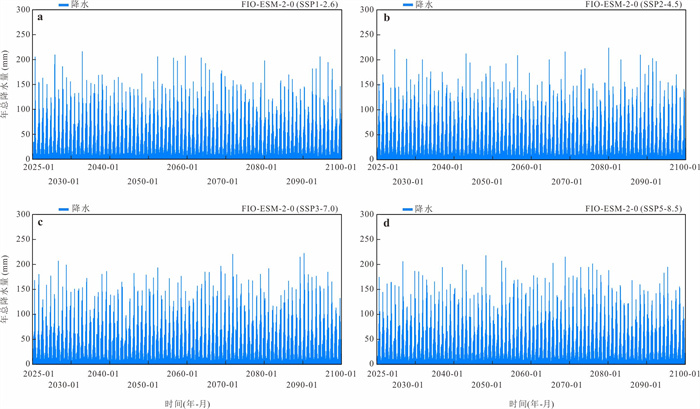
图 11 FIO-ESM-2-0模式不同SSP情景下长期降水预测
Fig. 11. Long-term precipitation projections by the FIO-ESM-2-0 model under SSPs
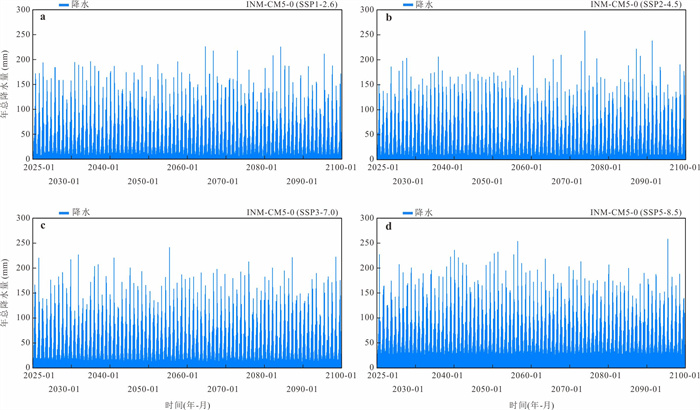
图 12 INM-CM5-0模式不同SSP情景下长期降水预测
Fig. 12. Long-term precipitation projections by the INM-CM5-0 model under SSPs
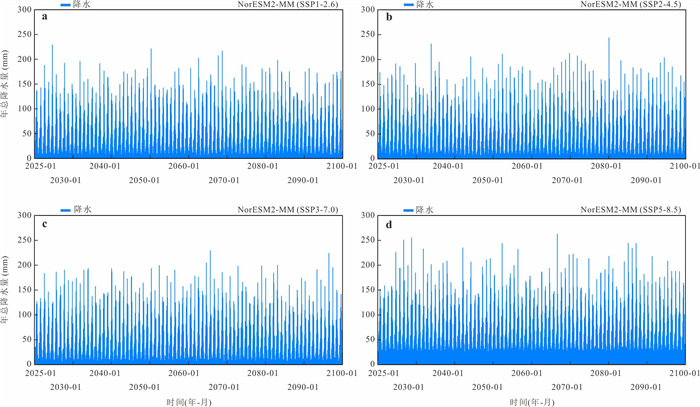
图 13 NorESM2-MM模式不同SSP情景下长期降水预测
Fig. 13. Long-term precipitation projections by the NorESM2-MM model under SSPs
表 1 CMIP6中18个GCM相关信息
Table 1. Description of eighteen CMIP6 GCMs in this study
序号 模式名称 研究机构 国家 空间分辨率(经向网格数×纬向网格数) No.1 BCC-CSM2-MR 中国国家气候中心 中国 320×160 No.2 CAMS-CSM1-0 中国气象科学研究院 中国 320×160 No.3 CAS-ESM2-0 中国科学院大气物理研究所 中国 256×128 No.4 CESM2-WACCM 美国国家大气研究中心 美国 288×192 No.5 CIESM 清华大学 中国 288×192 No.6 CMCC-CM2-SR5 欧洲-地中海气候变化中心 意大利 288×192 No.7 CMCC-ESM2 意大利气候研究中心 意大利 288×192 No.8 CNRM-CM6-1-HR 法国国家气候研究中心 法国 256×128 No.9 EC-Earth3-Veg-LR 欧盟地球系统模式联盟 欧洲 320×160 No.10 FGOALS-f3-L 中国科学院大气物理研究所 中国 288×180 No.11 FIO-ESM-2-0 中国自然资源部第一海洋研究所 中国 288×192 No.12 GFDL-ESM4 美国地球物理流体力学实验室 美国 288×180 No.13 INM-CM4-8 俄罗斯科学院计算数学研究所 俄罗斯 180×120 No.14 INM-CM5-0 俄罗斯科学院计算数学研究所 俄罗斯 540×360 No.15 MPI-ESM1-2-HR 德国气候和地球系统研究中心 德国 384×192 No.16 MRI-ESM2-0 日本气象研究所 日本 320×160 No.17 NorESM2-MM 挪威地球系统气候模式联盟 挪威 288×192 No.18 TaiESM1 中央研究院环境变化研究中心 中国台湾 288×192 注:GCMs信息来源于CMIP6数据官网( https://esgf-node.llnl.gov/projects/cmip6 ). 下载: 导出CSV
表 2 流域各站点年均降水趋势分析
Table 2. Annual precipitation trend analysis for each station
站点名称 降水量趋势检验 数据使用年限(年) Zc 显著性水平 卢氏 0.40 * 1976—2000 灵口 -0.21 * 1976—2000 三要 -0.72 * 1976—2000 麻坪 0.31 * 1976—2000 石门峪 -0.82 * 1976—2000 桑坪 -0.49 * 1976—2000 柏峪寺 -0.58 * 1976—2000 官坡 -0.44 * 1976—2000 木桐沟 -0.54 * 1976—2000 流域面平均 -0.07 * 1976—2000 注:表中“*”表示显著(5%显著性水平对应的Zc值为±1.96).
下载: 导出CSV
表 3 优选GCMs模拟降水在QM误差订正前后对比分析
Table 3. Typical characteristics of precipitation before and after QM bias correction under observations and selected GCMs
阶段 变化指标(m) 具体数值(mm) 与历史观测值间偏差率(%) 历史观测 最大月值 260.61 多年平均 630.22 季节平均 春季(3-5) 145.60 夏季(6-8) 306.61 秋季(9-11) 152.55 冬季(12-2) 25.67 CNRM-CM6-1-HR模式 误差订正前 最大月值 302.42 16.04 多年平均 775.91 23.1218.75 季节平均 春季(3-5) 172.96 18.75 夏季(6-8) 371.44 21.14 秋季(9-11) 173.73 13.90 冬季(12-2) 49.12 91.80 误差订正后 最大月值 264.64 1.53 多年平均 642.17 1.89 季节平均 春季(3-5) 147.78 1.44 夏季(6-8) 309.83 1.04 秋季(9-11) 153.42 0.59 冬季(12-2) 27.40 7.03 FIO-ESM-2-0模式 误差订正前 最大月值 302.12 15.92 多年平均 714.53 13.38 季节平均 春季(3-5) 187.15 28.50 夏季(6-8) 364.82 18.98 秋季(9-11) 204.36 33.97 冬季(12-2) 51.49 100.78 误差订正后 最大月值 261.42 0.31 多年平均 637.91 1.22 季节平均 春季(3-5) 147.53 1.30 夏季(6-8) 311.26 1.50 秋季(9-11) 158.91 4.20 冬季(12-2) 23.22 -9.38 INM-CM5-0模式 误差订正前 最大月值 284.32 9.09 多年平均 695.81 10.41 季节平均 春季(3-5) 200.14 37.43 夏季(6-8) 354.25 15.53 秋季(9-11) 201.43 32.07 冬季(12-2) 43.72 70.70 误差订正后 最大月值 261.33 0.27 多年平均 633.27 0.48 季节平均 春季(3-5) 151.81 4.26 夏季(6-8) 308.89 0.72 秋季(9-11) 163.44 7.15 冬季(12-2) 22.92 -10.55 NorESM2-MM模式 误差订正前 最大月值 297.02 13.97 多年平均 705.63 11.96 季节平均 春季(3-5) 167.37 14.90 夏季(6-8) 347.12 13.21 秋季(9-11) 198.64 30.23 冬季(12-2) 38.55 50.39 误差订正后 最大月值 266.72 2.34 多年平均 635.71 0.87 季节平均 春季(3-5) 146.44 0.55 夏季(6-8) 307.90 0.42 秋季(9-11) 159.32 4.46 冬季(12-2) 26.16 1.95
下载: 导出CSV
-
Ascott, M. J., Mansour, M. M., Bloomfield, J. P., et al., 2019. Analysis of the Impact of Hydraulic Properties and Climate Change on Estimations of Borehole Yields. Journal of Hydrology, 577: 123998. https://doi.org/10.1016/j.jhydrol.2019.123998 Bennett, J. C., Grose, M. R., Corney, S. P., et al., 2014. Performance of an Empirical Bias-Correction of a High-Resolution Climate Dataset. International Journal of Climatology, 34(7): 2189-2204. https://doi.org/10.1002/joc.3830 Bohra, S. S., Anvari-Moghaddam, A., 2022. A Comprehensive Review on Applications of Multicriteria Decision-Making Methods in Power and Energy Systems. International Journal of Energy Research, 46(4): 4088-4118. https://doi.org/10.1002/er.7517 Bornemann, F. J., Rowell, D. P., Evans, B., et al., 2019. Future Changes and Uncertainty in Decision-Relevant Measures of East African Climate. Climatic Change, 156(3): 365-384. https://doi.org/10.1007/s10584-019-02499-2 Chen, J., Brissette, F. P., Chaumont, D., et al., 2013. Finding Appropriate Bias Correction Methods in Downscaling Precipitation for Hydrologic Impact Studies over North America. Water Resources Research, 49(7): 4187-4205. https://doi.org/10.1002/wrcr.20331 Enayati, M., Bozorg-Haddad, O., Bazrafshan, J., et al., 2021. Bias Correction Capabilities of Quantile Mapping Methods for Rainfall and Temperature Variables. Journal of Water and Climate Change, 12(2): 401-419. https://doi.org/10.2166/wcc.2020.261 Feng, X. M., Cheng, W., Fu, B. J., et al., 2016. The Role of Climatic and Anthropogenic Stresses on Long-Term Runoff Reduction from the Loess Plateau, China. Science of the Total Environment, 571: 688-698. https://doi.org/10.1016/j.scitotenv.2016.07.038 Grabowski, S., Kowalski, T. M., 2021. Algorithms for All-Pairs Hamming Distance Based Similarity. Software: Practice and Experience, 51(7): 1580-1590. https://doi.org/10.1002/spe.2978 Hawkins, E., Sutton, R., 2011. The Potential to Narrow Uncertainty in Projections of Regional Precipitation Change. Climate Dynamics, 37(1-2): 407-418. https://doi.org/10.1007/s00382-010-0810-6 Hao, Z. C., Li, L., Wang, J. H., et al., 2007. Impact of Climate Change on Surface Water Resources. Earth Science, 32(3): 425-432 (in Chinese with English abstract). Li, J. R., Niu, Z. G., Feng, L., et al., 2020. Simulation and Prediction of Extreme Temperature Indices in Yangtze and Yellow River Basins by CMIP5 Models. Earth Science, 45(6): 1887-1904(in Chinese with English abstract). Nayak, S., Upadhyay, S., D'Souza, S., et al., 2023. Hamming Distance between the Strings Generated by Adjacency Matrix of a Subgraph Complementary Graph and Their Sum. Discrete Mathematics, Algorithms and Applications, 15(4): 2250102. https://doi.org/10.1142/s1793830922501026 Nguyen, H., Mehrotra, R., Sharma, A., 2016. Correcting for Systematic Biases in GCM Simulations in the Frequency Domain. Journal of Hydrology, 538: 117-126. https://doi.org/10.1016/j.jhydrol.2016.04.018 Piniewski, M., Szcześniak, M., Huang, S. C., et al., 2018. Projections of Runoff in the Vistula and the Odra River Basins with the Help of the SWAT Model. Hydrology Research, 49(2): 303-317. https://doi.org/10.2166/nh.2017.280 Prasanna, V., 2016. Assessment of South Asian Summer Monsoon Simulation in CMIP5-Coupled Climate Models during the Historical Period (1850-2005). Pure and Applied Geophysics, 173(4): 1379-1402. https://doi.org/10.1007/s00024-015-1126-6 Sharma, A., Goyal, M. K., 2020. Assessment of the Changes in Precipitation and Temperature in Teesta River Basin in Indian Himalayan Region under Climate Change. Atmospheric Research, 231: 104670. https://doi.org/10.1016/j.atmosres.2019.104670 Tang, X. G., Wang, L. J., Wang, H. Y., et al., 2024. Predicted Climate Change will Increase Landslide Risk in Hanjiang River Basin, China. Journal of Earth Science, 35(4): 1334-1354. https://doi.org/10.1007/s12583-021-1511-2 Taylor, K. E., 2001. Summarizing Multiple Aspects of Model Performance in a Single Diagram. Journal of Geophysical Research: Atmospheres, 106(D7): 7183-7192. https://doi.org/10.1029/2000jd900719 Teutschbein, C., Seibert, J., 2012. Bias Correction of Regional Climate Model Simulations for Hydrological Climate-Change Impact Studies: Review and Evaluation of Different Methods. Journal of Hydrology, 456/457: 12-29. https://doi.org/10.1016/j.jhydrol.2012.05.052 Ripple, W. J., Wolf, C., Gregg, J. W., et al., 2024. The 2024 State of the Climate Report: Perilous Times on Planet Earth. BioScience, 74(12): 812-824. https://doi.org/10.1093/biosci/biae087 Wu, X. J., Liu, J. K., Niu, Z. G., et al., 2025. Projection of Population Exposure to Compound Extreme Climate Events in the Yangtze River Basin. Journal of Earth Science, 36(6): 2771-2788. https://doi.org/10.1007/s12583-025-0261-y Yang, P., Xu, F., Xia, J., et al., 2025. Agricultural Drought Vulnerability in the Middle Reaches of Yangtze River Basin under Environmental Change. Journal of Earth Science, 36(1): 184-196. https://doi.org/10.1007/s12583-023-1865-8 Yue, S. R., Wang, L. C., Cao, Q., et al., 2025. Assessment of Future Cotton Production in the Tarim River Basin under Climate Model Projections and Water Management. Journal of Earth Science, 36(4): 1780-1792. https://doi.org/10.1007/s12583-025-0213-6 Zhang, Y. Q., You, Q. L., Lin, H. B., et al., 2015. Analysis of Dry/Wet Conditions in the Gan River Basin, China, and Their Association with Large-Scale Atmospheric Circulation. Global and Planetary Change, 133: 309-317. https://doi.org/10.1016/j.gloplacha.2015.09.005 郝振纯, 李丽, 王加虎, 等, 2007. 气候变化对地表水资源的影响 . 地球科学, 32(3): 425-432. 李佳瑞, 牛自耕, 冯岚, 等, 2020. CMIP5模式对长江和黄河流域极端气温指标的模拟与预估. 地球科学, 45(6): 1887-1904. doi: 10.3799/dqkx.2020.116 -
 dqkxzx-51-6-2129_ESM.zip

-

 点击查看大图
计量
- 文章访问数: 24
- HTML全文浏览量: 13
- PDF下载量: 4
- 被引次数: 0
