




Simulation of Non-Point Source Nitrogen and Phosphorus Pollution Load Distribution in Sihu Watershed Based on SWAT Model
-
摘要:
为精准识别四湖流域非点源氮磷污染的来源、时空分布特征及关键影响因素,为流域水污染防控提供科学依据,解决当前流域内湖泊水体富营养化突出的问题.以四湖流域为研究区,构建SWAT模型对流域内非点源氮磷污染的时空分布进行模拟.研究表明,该模型对流域内径流、总氮(TN)和总磷(TP)均具有较好的拟合效果;时间上,2010—2018年TN、TP负荷呈先升后降趋势,2016年达峰值,2017—2018年连续下降,年内呈“汛期高、非汛期低”的特征;空间上,氮磷负荷较高的子流域集中于流域中下游,分别为11、24、25、32、33号等子流域,耕地与水域是流域内氮磷产生的主要污染源.四湖流域氮磷污染负荷时空分布受径流、土地利用及降雨综合影响,时间上汛期及空间上湖泊、农业区是防控重点,可通过削减化肥使用、控制水产养殖规模、保护湿地等措施降低污染负荷.
Abstract:To accurately identify the sources, spatiotemporal distribution characteristics and key influencing factors of non-point source nitrogen and phosphorus pollution in the Sihu watershed, it provides a scientific basis for water pollution prevention and control in the basin, and addresses the prominent problem of lake eutrophication in the current watershed. Taking the Sihu watershed as the study area, a SWAT model was constructed to simulate the spatiotemporal distribution of non-point source nitrogen and phosphorus pollution in the basin. The results show that the model has a good fitting effect on runoff, total nitrogen (TN) and total phosphorus (TP) in the basin. Temporally, the TN and TP loads from 2010 to 2018 first increased and then decreased, reaching a peak in 2016, followed by a continuous decline from 2017 to 2018, with the characteristic of "high in flood season and low in non-flood season" within a year. Spatially, the sub-watersheds with high nitrogen and phosphorus loads are concentrated in the middle and lower reaches of the basin, namely sub-watersheds 11, 24, 25, 32, 33, etc. Cultivated land and water areas are the main pollution sources of nitrogen and phosphorus in the basin. The spatiotemporal distribution of nitrogen and phosphorus pollution loads in the Sihu watershed is comprehensively affected by runoff, land use and rainfall. Temporally, the flood season and spatially, lakes and agricultural areas are the key points for prevention and control. Pollution loads can be reduced by measures such as reducing chemical fertilizer use, controlling the scale of aquaculture, and protecting wetlands.
-
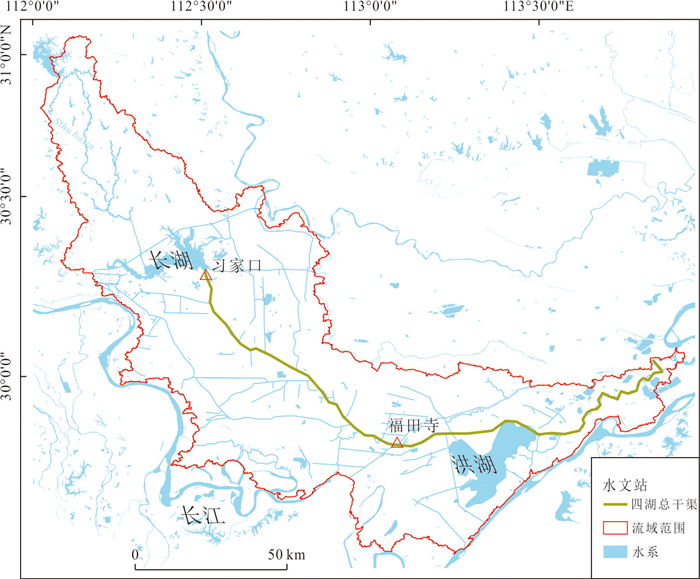
图 1 研究区位置及水系分布
Fig. 1. Location of the study area and distribution of the water system
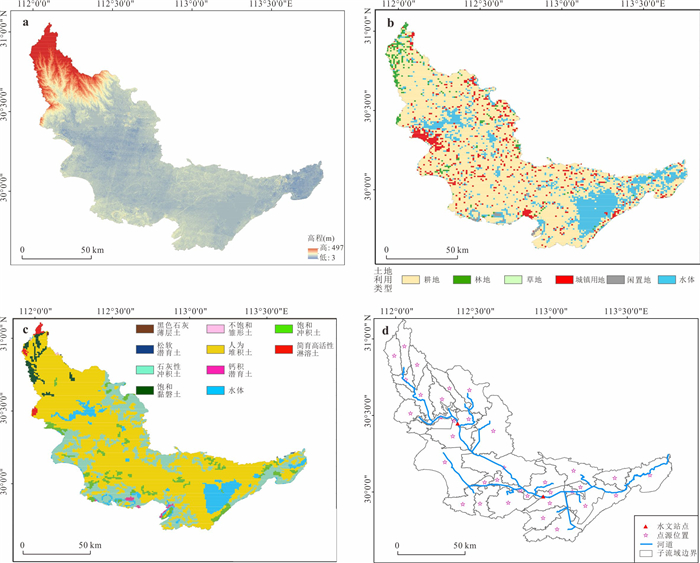
图 2 四湖流域: DEM图(a)、土地利用类型图(b)、土壤类型图(c)及水文站点及点源分布(d)
Fig. 2. Maps of the Sihu watershed: DEM map (a), land use type map (b), soil type map (c), and hydrological station and point source distribution map (d)
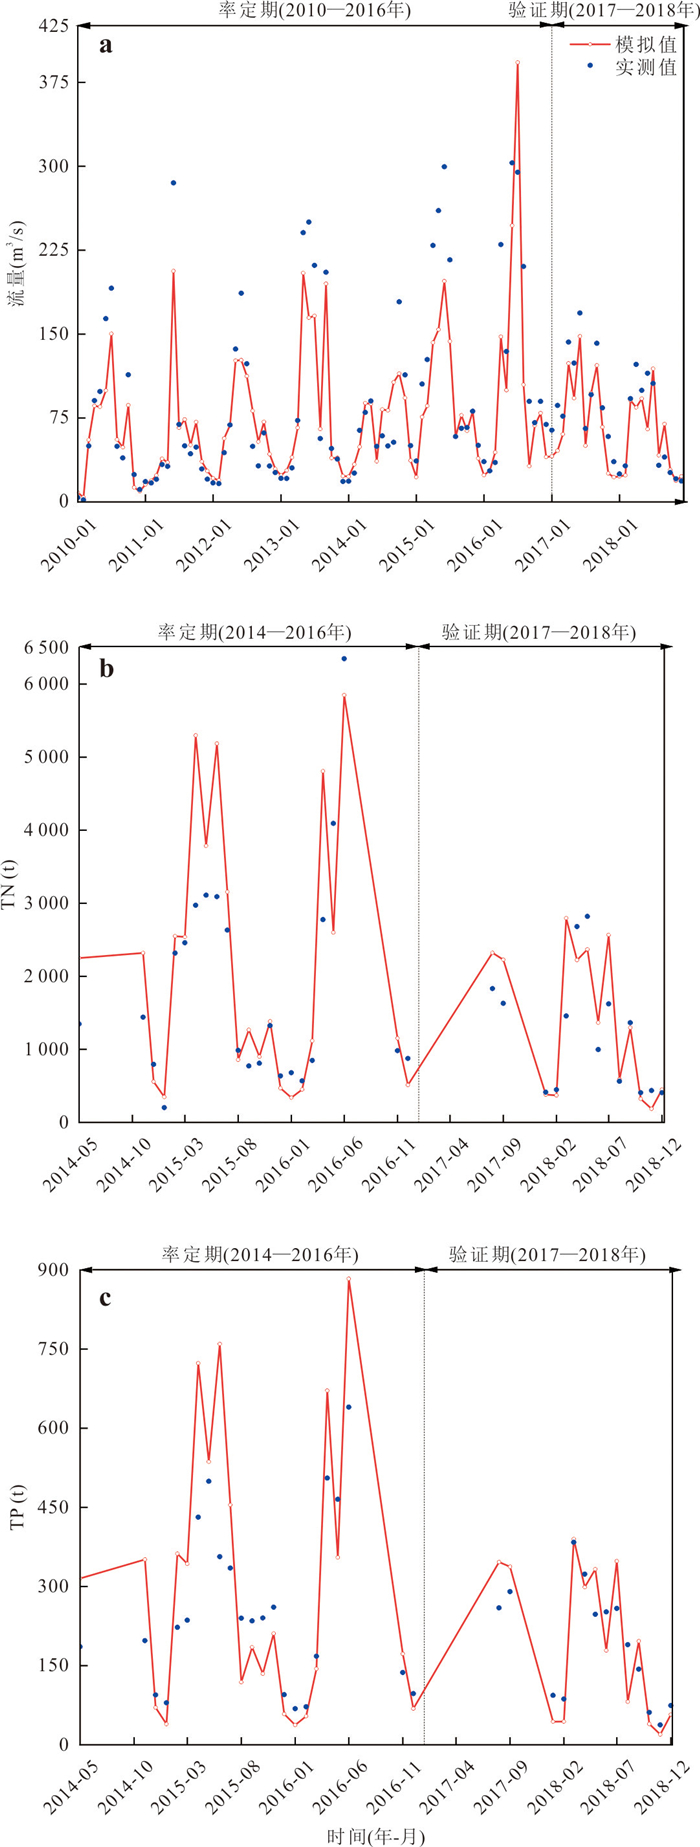
图 3 福田寺站控制断面逐月径流量(a)、总氮(b)和总磷(c)模拟值与实测值对比
Fig. 3. Monthly comparison between simulated and measured values of runoff (a), total nitrogen (TN) (b), and total phosphorus (TP) (c) at the control section of Futiansi station
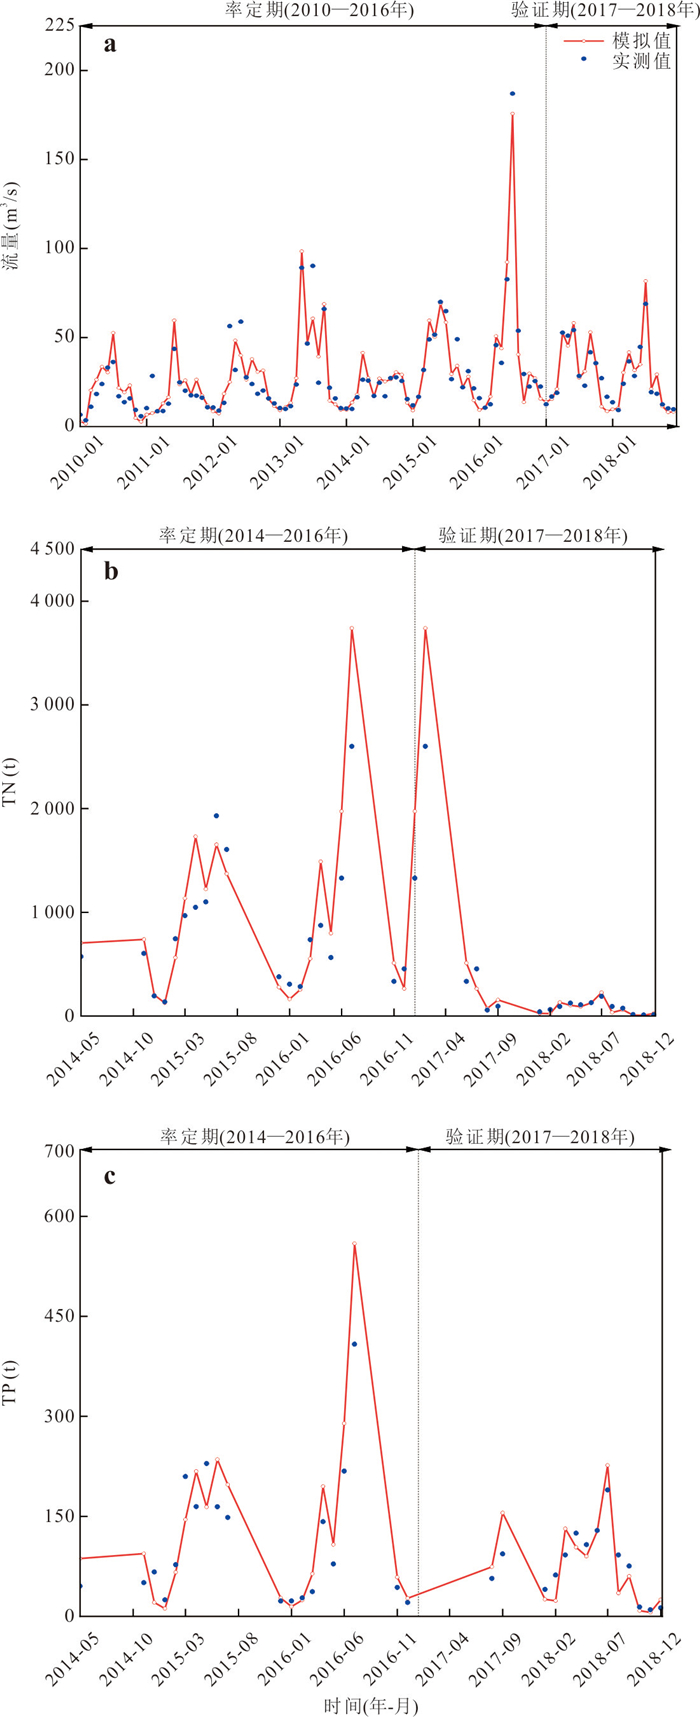
图 4 习家口站控制断面逐月径流量(a)、总氮(b)和总磷(c)模拟值与实测值对比
Fig. 4. Monthly comparison between simulated and measured values of runoff (a), total nitrogen (TN) (b), and total phosphorus (TP) (c) at the control section of Xijiakou station
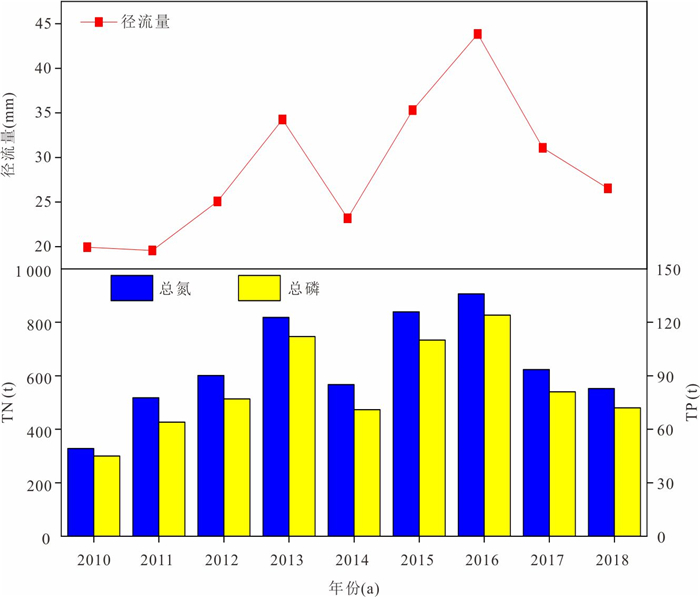
图 5 长湖2010—2018年径流量及TN、TP年负荷变化
Fig. 5. Annual variations of runoff, TN and TP loads in Changhu Lake from 2010 to 2018
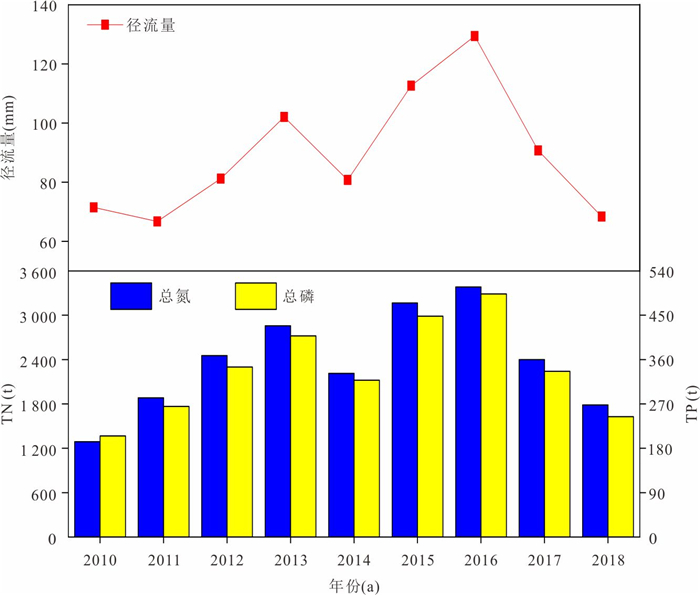
图 6 洪湖2010—2018年径流量及TN、TP年负荷变化
Fig. 6. Annual variations of runoff, TN and TP loads in Honghu Lake from 2010 to 2018
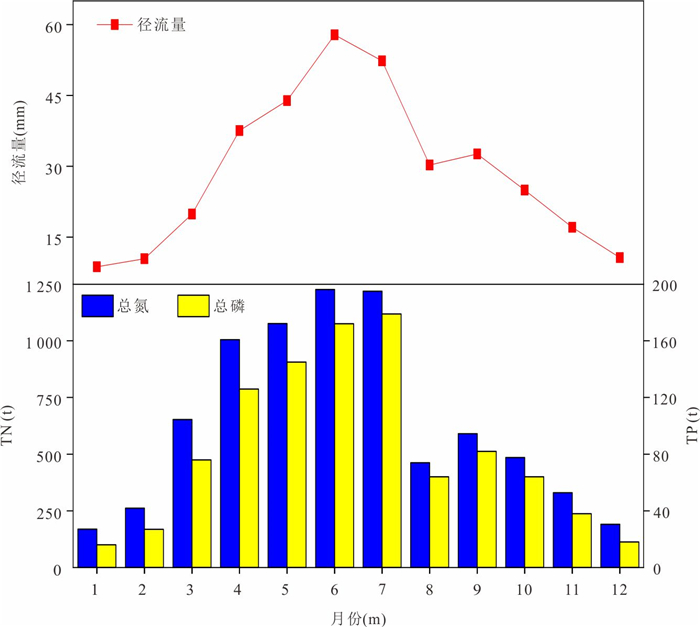
图 7 长湖2010—2018年月均径流量及TN、TP月均负荷
Fig. 7. Monthly average variations of runoff, TN and TP loads in Changhu Lake from 2010 to 2018
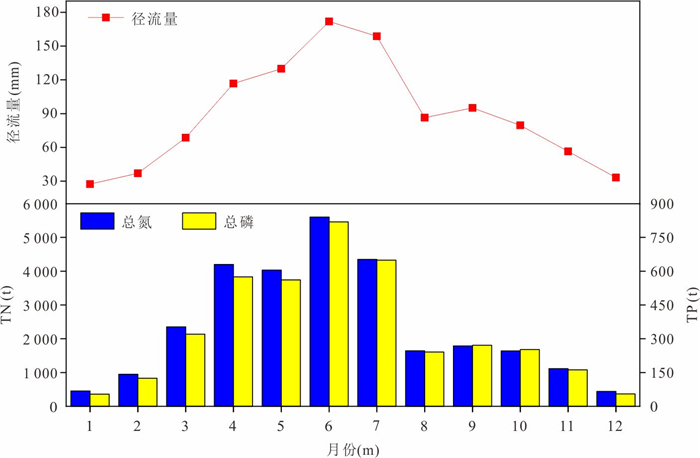
图 8 洪湖2010—2018年月均径流量及TN、TP月均负荷
Fig. 8. Monthly average variations of runoff, TN and TP loads in Honghu Lake from 2010 to 2018
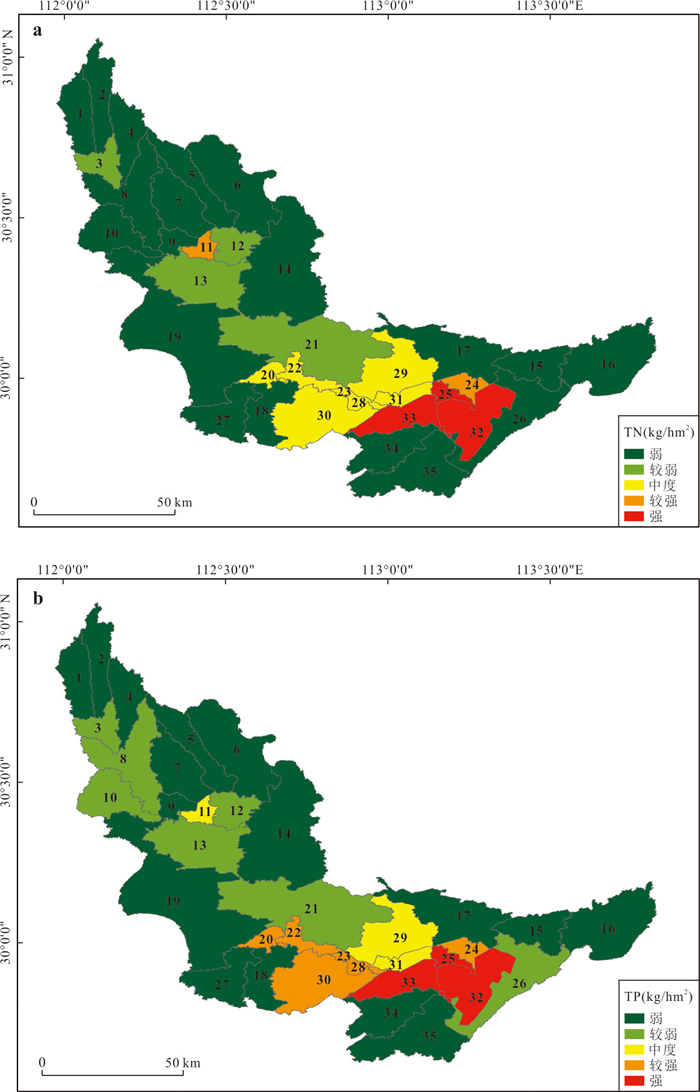
图 9 四湖流域多年平均TN(a)和TP(b)负荷空间分布
Fig. 9. Spatial distribution of multi-year average TN (a) and TP (b) loads in the Sihu watershed
表 1 模型数据描述及来源
Table 1. Description of model data and sources
类型 名称 描述 时间尺度 格式 来源 空间数据 DEM 30 m分辨率 GRID 中国科学院计算机网络信息中心地理空间数据云平台
(http://www.gscloud.cn )土地利用 1 000 m分辨率 GRID 中国科学院资源环境科学与数据平台
(https://www.resdc.cn )土壤类型 30 m分辨率 GRID 世界土壤学数据库(HWSD)
(https://www.fao.org/ )属性数据 气象数据 降雨和气温等 逐日数据 DBF 中国气象同化驱动数据集(CMADSV1.2)
(https://poles.tpdc.ac.cn )水文数据 流量 逐月数据 DBF 中国水利统计年鉴(2018)① 水质数据 总氮和总磷等 逐月数据 DBF 荆州市生态环境局
(http://sthjj.jingzhou.gov.cn/hjsj/ )点源污染数据 排污口位置及氮磷污染负荷等 年均数据 DBF 湖北省生态环境厅
(http://219.140.164.18:8045/pointModule/#/hubeiPoint/dashboard )非点源污染数据 农村生活、禽畜养殖、水产养殖、农田化肥等 年均数据 DBF 湖北农村统计年鉴(2019)② 注:①中华人民共和国水利部,2018. 中国水利统计年鉴(2018).北京市:中国水利水电出版社;②湖北农村统计年鉴编辑委员会,2019. 湖北农村统计年鉴(2019).北京市:中国统计出版社.  下载: 导出CSV
表 2 参数率定结果
Table 2. Parameter calibration results
参数 中文含义 单位 取值方式 变动范围 参数变动值 CANMX.hru 最大冠层蓄水量 mm V 0~100 0.017 ESCO.hru 土壤蒸发补偿系数 - V 0~1 0.660 CN2.mgt SCS径流曲线数 - R -0.5~0.5 0.217 SOL_Z().sol 土壤底部埋深 mm R -0.5~0.5 0.299 SOL_BD().sol 土壤湿容重 g/cm3 R -0.5~0.5 0.274 SOL_K().sol 饱和水力传导系数 mm/h R -0.5~0.5 -0.082 GW_DELAY.gw 地下水滞后系数 day V 0~500 34.618 CH_K2.rte 主河道有效水力传导率 m/s V 0.01~500 21.360 RCHRG_DP.gw 地下水下渗系数 - V 0~1 0.387 SPCON.bsn 泥沙输移线性系数 - V 0.000 1~0.01 0.005 NPERCO.bsn 土壤剖面渗透系数 - V 0~1 0.000 004 BC1.swq 氨氮生物氧化速度 day-1 V 0.1~1 0.216 CDN.bsn 反硝化速率系数 - V 0~5 3.099 USLE_K().sol USLE土壤可蚀性因子 t·ha·h/(MJ·mm) R -0.2~0.2 -0.013 BIOMIX.mgt 生物混合效率 - V 0~1 0.351 SDNCO.bsn 反硝化的土壤含水量阈值 - V 0~1 0.083 PHOSKD.bsn 土壤磷分配系数 m3/kg V 100~200 188.341 PSP.bsn 磷溶解度系数 - V 0.01~0.7 0.481 注:单位中“-”表示该参数无单位.
下载: 导出CSV
表 3 站点模拟精度统计
Table 3. Statistics of station simulation accuracy
时期 项目 指标 习家口 福田寺 时期 项目 指标 习家口 福田寺 率定期 径流 R2 0.88 0.83 验证期 径流 R2 0.88 0.82 NSE 0.88 0.79 NSE 0.83 0.74 PBIAS -2.1 13.5 PBIAS -2.6 16.0 总氮 R2 0.81 0.83 总氮 R2 0.80 0.82 NSE 0.61 0.65 NSE 0.63 0.71 PBIAS -15.14 -21.63 PBIAS 16.59 19.06 总磷 R2 0.84 0.88 总磷 R2 0.71 0.82 NSE 0.68 0.67 NSE 0.61 0.70 PBIAS -20.51 -20.32 PBIAS -9.53 12.70
下载: 导出CSV
表 4 氮磷营养物质负荷等级划分
Table 4. Classification of nitrogen and phosphorus nutrient load levels
评价因子 等级划分标准 TN(kg/hm2) < 10 10~30 30~50 50~70 >70 TP(kg/hm2) < 1 1~4 4~7 7~10 >10 负荷强度 弱 较弱 中度 较强 强
下载: 导出CSV
表 5 四湖流域各土地利用类型氮磷污染负荷
Table 5. Nitrogen and phosphorus pollution loads of different land use types in the Sihu watershed
土地利用类型 面积
(hm2)面积占比
(%)TN TP 负荷量(t) 占比(%) 负荷量(t) 占比(%) 耕地 727 020.0 71.1 6 105.1 40.7 891.8 41.1 水域 181 953.0 17.8 4 275.1 28.5 629.2 29.0 城镇用地 79 719.0 7.8 2 340.0 15.6 334.1 15.4 其他地类* 34 085.0 3.3 2 280.0 15.2 314.6 14.5 注:*包括林地、草地、闲置地.
下载: 导出CSV
表 6 四湖流域氮磷负荷前五的子流域信息
Table 6. Information of the Top 5 sub-watersheds by nitrogen and phosphorus loads in the Sihu watershed
序号 子流域编号 水域占比
(%)耕地占比
(%)年均降雨
(mm)年均径流
(mm)年均TN
(kg/hm2)年均TP
(kg/hm2)1 32 98.0 1.4 1 055.9 89.3 72.8 10.4 2 11 87.7 11.4 950.7 52.8 53.0 6.9 3 24 47.4 50.0 1 056.0 62.4 57.9 8.5 4 25 45.8 54.0 1 056.4 76.1 77.6 10.9 5 33 27.4 60.2 957.1 74.9 72.6 9.2
下载: 导出CSV
表 7 四湖流域各子流域所在行政区及河段
Table 7. Administrative regions and river reaches of each sub-watersheds in the Sihu watershed
子流域编号 行政区 河段 子流域编号 行政区 河段 1 掇刀区 内荆河 19 江陵县 西干渠 2 掇刀区 内荆河 20 监利市 西干渠 3 沙洋县 内荆河 21 潜江市 四湖总干渠 4 沙洋县 内荆河 22 监利市 四湖总干渠 5 沙洋县 西荆河 23 监利市 四湖总干渠 6 沙洋县 西荆河 24 洪湖市 四湖总干渠 7 沙洋县 内荆河 25 洪湖市 四湖总干渠 8 沙洋县 内荆河 26 洪湖市 四湖总干渠 9 沙市区 西干渠 27 石首市 西干渠 10 荆州区 西干渠 28 监利市 四湖总干渠 11 沙市区 长湖 29 监利市 四湖总干渠 12 潜江市 内荆河 30 监利市 西干渠 13 沙市区 四湖总干渠 31 监利市 四湖总干渠 14 潜江市 东干渠 32 洪湖市 洪湖 15 洪湖市 四湖总干渠 33 监利市 四湖总干渠 16 洪湖市 四湖总干渠 34 监利市 中心河 17 洪湖市 西干渠 35 监利市 赤湘河 18 石首市 西干渠
下载: 导出CSV
-
Arnold, J. G., Srinivasan, R., Muttiah, R. S., et al., 1998. Large Area Hydrologic Modeling and Assessment Part Ⅰ: Model Development. Journal of the American Water Resources Association, 34(1): 73-89. https://doi.org/10.1111/j.1752-1688.1998.tb05961.x Chen, P., Yuan, Y. P., Li, W. H., et al., 2021a. Assessing the Impacts of Recent Crop Expansion on Water Quality in the Missouri River Basin Using the Soil and Water Assessment Tool. Journal of Advances in Modeling Earth Systems, 13(6): e2020MS002284. https://doi.org/10.1029/2020ms002284 Chen, S., Wang, S. M., Yu, Y. X., et al., 2021b. Temporal Trends and Source Apportionment of Water Pollution in Honghu Lake, China. Environmental Science and Pollution Research, 28(42): 60130-60144. https://doi.org/10.1007/s11356-021-14828-z Cheng, J. R., Gong, Y. M., Zhu, D. Z., et al., 2021. Modeling the Sources and Retention of Phosphorus Nutrient in a Coastal River System in China Using SWAT. Journal of Environmental Management, 278: 111556. https://doi.org/10.1016/j.jenvman.2020.111556 Galloway, J. N., Dentener, F. J., Capone, D. G., et al., 2004. Nitrogen Cycles: Past, Present, and Future. Biogeochemistry, 70(2): 153-226. https://doi.org/10.1007/s10533-004-0370-0 Gassman, P. W., Reyes, M. R., Green, C. H., et al., 2007. The Soil and Water Assessment Tool: Historical Development, Applications, and Future Research Directions. Transactions of the Asabe, 50(4): 1211-1250. https://doi.org/10.13031/2013.23637 Li, F., Qiu, Z. Z., Zhang, J. D., et al., 2019. Temporal Variation of Major Nutrients and Probabilistic Eutrophication Evaluation Based on Stochastic—Fuzzy Method in Honghu Lake, Middle China. Science China Technological Sciences, 62(3): 417-426. https://doi.org/10.1007/s11431-017-9264-8 Li, X. M., Zhu, T. B., He, Y. F., et al., 2022. Assessment of Eutrophication and Nitrogen and Phosphorus Carrying Capacity before and after Removing Pen Culture (2013—2018) in Lake Changhu, China. Environmental Science and Pollution Research, 29(4): 5674-5686. https://doi.org/10.1007/s11356-021-15908-w Liu, J., Gu, W. Q., Liu, Y. W., et al., 2023. Influence of Anthropogenic Nitrogen Inputs and Legacy Nitrogen Change on Riverine Nitrogen Export in Areas with High Agricultural Activity. Journal of Environmental Management, 338: 117833. https://doi.org/10.1016/j.jenvman.2023.117833 Liu, J., Gu, W. Q., Liu, Y. W., et al., 2022. Dynamic Characteristics of Net Anthropogenic Phosphorus Input and Legacy Phosphorus Reserves under High Human Activity: A Case Study in the Jianghan Plain. Science of the Total Environment, 836: 155287. https://doi.org/10.1016/j.scitotenv.2022.155287 Liu, X. M., Zhang, G. X., Sun, G. Z., et al., 2019. Assessment of Lake Water Quality and Eutrophication Risk in an Agricultural Irrigation Area: A Case Study of the Chagan Lake in Northeast China. Water, 11(11): 2380. https://doi.org/10.3390/w11112380 Moriasi, D. N., Gitau, M. W., Pai, N., et al., 2015. Hydrologic and Water Quality Models: Performance Measures and Evaluation Criteria. Transactions of the American Society of Agricultural and Biological Engineers, 58: 1763-1785. https://doi.org/10.13031/TRANS.58.10715. Olivera, F., Valenzuela, M., Srinivasan, R., et al., 2006. ArcGIS-SWAT: A Geodata Model and GIS Interface for SWAT. Journal of the American Water Resources Association, 42(2): 295-309. https://doi.org/10.1111/j.1752-1688.2006.tb04496.x Santhi, C., Kannan, N., White, M., et al., 2014. An Integrated Modeling Approach for Estimating the Water Quality Benefits of Conservation Practices at the River Basin Scale. Journal of Environmental Quality, 43(1): 177-198. https://doi.org/10.2134/jeq2011.0460 Tang, X. Q., Wu, M., Yang, W. J., et al., 2012. Ecological Strategy for Eutrophication Control. Water Air and Soil Pollution, 223(2): 723-737. https://doi.org/10.1007/s11270-011-0897-3 Wang, H. Y., Li, T., Zhu, J. Q., et al., 2022. Effects of Extreme Water Levels on Nutrient Dynamics in a Large Shallow Eutrophic Lake (Changhu Lake, China). Journal of Freshwater Ecology, 37(1): 131-143. https://doi.org/10.1080/02705060.2021.2023053 Wu, H. J., Chen, B., 2015. Evaluating Uncertainty Estimates in Distributed Hydrological Modeling for the Wenjing River Watershed in China by GLUE, SUFI-2, and ParaSol Methods. Ecological Engineering, 76: 110-121. https://doi.org/10.1016/j.ecoleng.2014.05.014 Zhang, T., Ban, X., Wang, X. L., et al., 2017. Analysis of Nutrient Transport and Ecological Response in Honghu Lake, China by Using a Mathematical Model. Science of the Total Environment, 575: 418-428. https://doi.org/10.1016/j.scitotenv.2016.09.188 Zhang, X. N., Guo, Q. P., Shen, X. X., et al., 2015. Water Quality, Agriculture and Food Safety in China: Current Situation, Trends, Interdependencies, and Management. Journal of Integrative Agriculture, 14(11): 2365-2379. https://doi.org/10.1016/S2095-3119(15)61128-5 Zhang, Y. J., Chen, P., Li, J. L., et al., 2025. Simulation Study on Non-Point Source Nitrogen and Phosphorus Pollution Loads Distribution in the Fenhe River Basin Based on SWAT Model. Water Resources and Power, 43(8): 37-41 (in Chinese with English abstract). 张轶杰, 陈攀, 李京玲, 等, 2025. 基于SWAT模型的汾河流域非点源氮磷污染负荷分布模拟研究. 水电能源科学, 43(8): 37-41. -

 点击查看大图
计量
- 文章访问数: 17
- HTML全文浏览量: 15
- PDF下载量: 3
- 被引次数: 0
